Research Highlight
Calibrating Remote Sensing Data with Field Observations in the East River Watershed
December 12, 2018
The East River watershed encompasses 330 square kilometers of gorgeous mountainous terrain near Crested Butte, Colorado. To build better models of watershed processes and calibrate remote sensing data with observations on the ground, a diverse team of researchers spent two weeks this summer gathering soil and vegetation data from hundreds of individual sites within the watershed.
These detailed ground observations will be correlated with remote sensing data collected by a NEON Airborne Observation Platform (AOP) during the same time period. The correlations will be used to examine relationships between different ecological variables, from subsurface microbial activity to foliar chemistry. Combining ground and remote sensing data will also enable development of new models of watershed functioning and bridge the gaps between data collected at scales ranging from the microscopic to the geographic.
A Massive Collaborative Effort in Field Data Collection
The airborne remote sensing data collection was funded by the Watershed Function SFA, a Department of Energy (DOE) program studying the interactions among different components of watersheds, with contribution from Stanford University. Using NEON to conduct airborne remote sensing surveys was part of a study of the East River watershed led by Lawrence Berkeley National Laboratory (LBNL) and was coordinated through the NEON Assignable Assets program, which provides researchers with access to various aspects of NEON’s infrastructure.
The ground team was led by Dana Chadwick, an NSF postdoctoral fellow co-hosted by Stanford University's Department of Earth System Science and LBNL. In all, more than twenty researchers, from undergraduate students to principal investigators, came together to support the massive data collection effort. The field collection team brought together students and scientists from LBNL, Stanford, Berkeley, Rocky Mountain Biological Lab, Desert Research Institute, Harvard, Fort Lewis College, and the USGS, representing a range of disciplines including geochemical modeling, hydrology, soil science, biochemistry and botany.
Dana says, "This was collaborative group science at its finest. Our team was composed of grad students, undergrads, postdoctoral researchers, technicians and investigators with diverse research backgrounds. It brought together a large group of people who don't often interact in the field. I am hopeful that many ongoing collaborations will be developed as a result of this community effort."
In addition to the collection of physical samples and species information, Nicola Falco, a postdoc at LBNL, led a geophysics team working alongside the sample collection effort. They collected geophysical data which will be processed to understand the distribution of soil moisture through the subsurface.
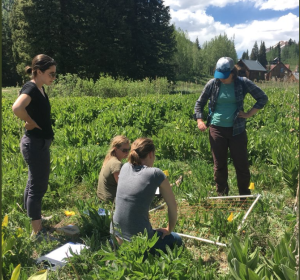
The teams collected samples of leaves, soils, litter, roots and microbes from 438 designated locations within the watershed research area. The collection locations were organized into 12 sub-sites that represent different ecosystems within four distinct watersheds in the Upper East River Basin. Between June 14 and June 28, 2018, the ground teams collected more than 4,000 physical samples along with geophysical measurements and information on plant species. Soil samples were sent to Corey Lawrence’s lab at USGS for initial processing and to the Maher lab at Stanford to be analyzed for nutrients and bulk chemistry. This analysis is supported by a grant through NSF’s Signals in the Soils program. In addition, Eoin Brodie’s group at LBNL collected soil subsamples for microbial analysis.
Dana acted as the point person coordinating field collection activities with the remote sensing team, led by the NEON project's Matt DeVoe. The flights over the East River watershed were among the first flown through the NEON Assignable Assets program. Ground and airborne data were collected for each location within 72 hours of each other so that observations would be made within the same time frames and under similar weather conditions.
Connecting Ground and Airborne Observations
The ground data collected by the Stanford-LBNL team will be correlated with remote sensing data collected by the AOP. High-resolution GPS measurements were taken at each sampling location by Nicola’s team so that they could be easily found in the remote sensing imagery.
Correlating the datasets will help researchers link data collected through remote sensing with the ecological data gathered on the ground. Airborne remote sensing with the AOP allows researchers to collect surface data across broad geographic areas at scales and speeds not possible to achieve through ground collection. But it does not provide detailed information about soil characteristics, hydrology, or subsurface processes and microbial communities. The team hopes to find correlations in the datasets between the observations made on the ground and data that can be gathered through remote sensing. This would allow future researchers to use remote sensing data to infer what is happening on the ground.
Dana explains, "We are creating datasets that will allow us to scale from local vertical profiles to a broader areas and link what is happening in the subsurface to what we are seeing from above. This will allow us to extrapolate processes using remote sensing data in ways that are not possible now and develop a more nuanced understanding of how subsurface ecosystem properties are distributed across the entire watershed."
The research team hopes that the study will lead to better models that can be used to further our understanding of watershed processes and how watersheds are changing across time. "There are still a lot of questions about watershed processes and how they are linked," says Dana. "For example, how are variations in topography, geography, soil chemicals or moisture levels linked to plant species distribution and foliar characteristics across landscapes? And how are changes in snowmelt and other variables impacting vegetation patterns and watershed function?"
Understanding these issues will help land managers and policy makers make more effective decisions to protect the watersheds that we all depend on. The Crested Butte study is helping to fill critical holes in our understanding.