AmeriFlux and the NEON Program Join Forces for Eddy Covariance Data
June 24, 2020
Want to watch the planet breathe? Eddy covariance data from the NEON flux towers allow you to do just that. These data measure the exchange of gases, water, and energy between ecosystems and the atmosphere.
The NEON program has now made data from its 47 flux towers available through the AmeriFlux data portal. This will allow researchers to synthesize data from the NEON flux towers with data from other towers across the AmeriFlux network. The data integration (described in a recent white paper) will also enable derivation of higher-level data products that are not currently available through the NEON Data Portal.
What is Eddy Covariance?
Simply put, eddy covariance is a technique for measuring the movement of energy and matter between the Earth’s surface and the atmosphere. Water, carbon dioxide, oxygen, nutrients, and energy are continually cycling through the ecosystem by the activities of plants, animals, and microbes and natural processes such as precipitation, wind, and radiation from the sun.
A flux tower has instruments that measure gas and energy exchanges (fluxes) at different levels of the vegetation canopy. These instruments take measurements up to 20 times per second to directly measure gas and water concentrations, wind speed and direction, temperature, radiation levels, and other variables. Tiny changes in these quantities as the air moves (eddies) allow researchers to estimate how energy, water, and gases are moving into and out of the ecosystem.
Eddy covariance data allow us to examine important ecological questions such as: What is the net exchange of greenhouse gases between an ecosystem and the atmosphere? How do changes in the structure and composition of an ecosystem impact its ability to sequester carbon dioxide (CO2) and other greenhouse gases? How do meteorological conditions affect the exchange of energy, water, and gases? How do these exchanges vary across ecosystem types and geographic regions?
Answering these questions will allow ecologists to better understand ecosystem processes and functions. Eddy covariance data help researchers build better models of climate change and ecosystem function that can be used to inform public policy and make better land management decisions.
Margaret Torn, an ecologist and biogeochemist at Berkeley Lab and University of California and the lead Principal Investigator for the AmeriFlux Management Project, explains, “Carbon exchange is a key indicator of many of the ecosystem services that people care about most—things like food production, timber growth, bioenergy production, clean air and water, and soil carbon sequestration. Understanding how gases and energy are exchanged gives us really powerful insights into the function of an ecosystem, which is important both for its own sake and for all of the ecosystem services we depend on.”
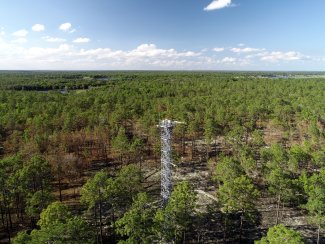
The tower at OSBS
Integrating Eddy Covariance Data Across Networks
AmeriFlux has been collecting and coordinating eddy covariance data across the Americas since 1996. The network provides a common platform for data sharing and collaboration for organizations and individual private investigators collecting flux tower data. There are now 470 registered flux tower sites in North, Central, and South America in the AmeriFlux network, many operated by individual researchers or universities. The towers collect eddy covariance data across a broad range of climate zones and ecosystem types, from Chile to Alaska and everywhere in between.
Now, data from the NEON project will be available through the AmeriFlux data portal. The NEON team has formatted data from the NEON flux towers to make it fully compatible with AmeriFlux data. This will allow researchers to view, download and analyze data from the NEON flux towers alongside data from all of the other flux towers in the AmeriFlux network.
With 47 flux towers at terrestrial field sites across the U.S., the NEON program is now the largest single contributor of flux tower data to the AmeriFlux network. NEON field sites are located in 20 ecoclimatic zones across the U.S., representing many distinct ecosystems. Eddy covariance data will be collected using the same methods at each site for the entire 30-year life of the Observatory, allowing for unprecedented comparability across both time and space.
Cove Sturtevant, a Research Scientist at the NEON program specializing in quality control of instrument data, says, “While data collection methods at most AmeriFlux sites are driven by the research questions of individual investigators, NEON is a community resource designed to answer very broad research questions. We have a wide range of instrumentation and take the same measurements in the same way across all sites.”
Margaret adds, “NEON is really important to us. Not only are they the largest operator of flux towers within the AmeriFlux network, their towers have the largest and richest sets of additional ecological data and metadata. They are set up to enable exploration of all kinds of ecological questions, not just carbon exchange. So with NEON, we have a rich set of observations of other aspects of the ecosystem such as plant diversity and structure, soil microbial diversity and abundance, and soil chemistry along with additional meteorological measurements. This expands the scope of research questions researchers can ask with the data.”
The Power of Networked Ecology
Over the last few years, the NEON and AmeriFlux teams have developed strong collaborative ties that include sharing expertise and technical know-how through workshops, forums, and relationships between individual investigators. NEON staff have been active participants in AmeriFlux annual meetings and technical workshops since 2016. Steven Metzger, the Science Lead for the NEON Surface-Atmosphere Exchange Team, is a member of the AmeriFlux Science Steering Committee. Several AmeriFlux leaders and site PIs have participated in the NEON Technical Working Groups and Science, Technology & Education Advisory Committee (STEAC), providing scientific guidance and technical direction for NEON’s flux tower measurement program.
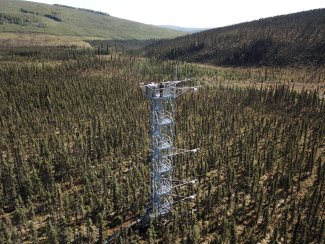
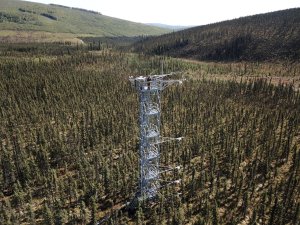
The tower at BONA
NEON benefits from the collaboration as well. NEON data are now fully compatible and comparable with data from the other 400+ flux towers in the network, allowing researchers to compare NEON and non-NEON sites and fill in data gaps. While the NEON program is still in its operational infancy, many of the AmeriFlux towers have data going back years or decades that can supplement the NEON data streams. Integrating with AmeriFlux will also enable derivation of additional higher-level data products which were part of the original NEON program plan but were later decommissioned. For example, while NEON only provides a calculation of net gas exchange, the AmeriFlux data tools will allow calculation of the gross inputs and outputs of carbon and other gases.
Both teams look forward to continuing the collaboration over the coming decades. Margaret says, “We have all benefited from the relationship. At the moment, NEON is a newbie in the network, but they will be in operation for a long time. That stability is really important. And they have expert dedicated staff that are really great to work with. This is a collaboration that will only get more valuable with time.”