NSF NEON, Operated by Battelle

Main navigation

  • About
    • NEON Overview
      • Vision and Management
      • Spatial and Temporal Design
      • History
    • About the NEON Biorepository
      • ASU Biorepository Staff
      • Contact the NEON Biorepository
    • Observatory Blog
    • Newsletters
    • Staff
    • FAQ
    • Contact Us

    About

  • Data
    • Data Portal
      • Data Availability Charts
      • API & GraphQL
      • Prototype Data
      • Externally Hosted Data
    • Data Collection Methods
      • Airborne Observation Platform (AOP)
      • Instrument System (IS)
        • Instrumented Collection Types
        • Aquatic Instrument System (AIS)
        • Terrestrial Instrument System (TIS)
      • Observational System (OS)
        • Observation Types
        • Observational Sampling Design
        • Sampling Schedules
        • Taxonomic Lists Used by Field Staff
        • Optimizing the Observational Sampling Designs
      • Protocols & Standardized Methods
    • Getting Started with NEON Data
      • neonUtilities for R and Python
      • Learning Hub
      • Code Hub
    • Using Data
      • Data Formats and Conventions
      • Released, Provisional, and Revised Data
      • Data Product Bundles
      • Usage Policies
      • Acknowledging and Citing NEON
      • Publishing Research Outputs
    • Data Notifications
    • NEON Data Management
      • Data Availability
      • Data Processing
      • Data Quality

    Data

  • Samples & Specimens
    • Biorepository Sample Portal at ASU
    • About Samples
      • Sample Types
      • Sample Repositories
      • Megapit and Distributed Initial Characterization Soil Archives
    • Finding and Accessing Sample Data
      • Species Checklists
      • Sample Explorer - Relationships and Data
      • Biorepository API
    • Requesting and Using Samples
      • Loans & Archival Requests
      • Usage Policies

    Samples & Specimens

  • Field Sites
    • Field Site Map and Info
    • Spatial Layers & Printable Maps

    Field Sites

  • Resources
    • Getting Started with NEON Data
    • Research Support Services
      • Field Site Coordination
      • Letters of Support
      • Mobile Deployment Platforms
      • Permits and Permissions
      • AOP Flight Campaigns
      • Research Support FAQs
      • Research Support Projects
    • Code Hub
      • neonUtilities for R and Python
      • Code Resources Guidelines
      • Code Resources Submission
      • NEON's GitHub Organization Homepage
    • Learning Hub
      • Tutorials
      • Workshops & Courses
      • Science Videos
      • Teaching Modules
    • Science Seminars and Data Skills Webinars
    • Document Library
    • Funding Opportunities

    Resources

  • Impact
    • Research Highlights
    • Papers & Publications
    • NEON in the News

    Impact

  • Get Involved
    • Upcoming Events
    • Research and Collaborations
      • Environmental Data Science Innovation and Inclusion Lab
      • Collaboration with DOE BER User Facilities and Programs
      • EFI-NEON Ecological Forecasting Challenge
      • NEON Great Lakes User Group
      • NCAR-NEON-Community Collaborations
    • Advisory Groups
      • Science, Technology & Education Advisory Committee
      • Technical Working Groups
    • NEON Ambassador Program
      • Exploring NEON-Derived Data Products Workshop Series
    • Partnerships
    • Community Engagement
    • Work Opportunities

    Get Involved

  • My Account
  • Search

Search

About

  • NEON Overview
  • About the NEON Biorepository
  • Observatory Blog
  • Newsletters
  • Staff
  • FAQ
  • Contact Us

Breadcrumb

  1. About
  2. Observatory Blog
  3. Groundwork in the snow for measurements in the wind

Groundwork in the snow for measurements in the wind

March 21, 2013

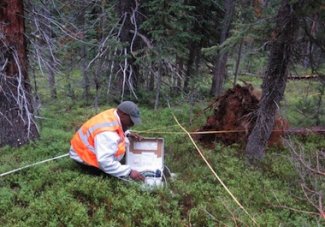
It was January 2013 in Toolik, Alaska, about 160 miles north of the Arctic Circle, and the temperature was minus 35 degrees Fahrenheit. Jeff Taylor (NEON atmospheric physicist) and I (NEON micrometeorologist) put on snow shoes to prevent ourselves from sinking into thigh-high snow. After hiking about a mile and a half, we finally reached the ridgeline. Jeff’s eyelashes and beard were covered with frost and his nose dripping with icicles. My hair and mask were also white with frost. Being from the southern part of China, this was my first experience in cold winter temperatures. I was a bit scared, but also excited and looking forward to our task of maintaining the weather station in the field.
 
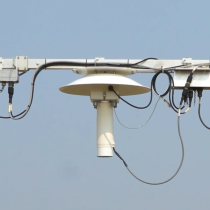
We had less than 4 hours of daylight to find our temporary weather station at the future NEON tower site, swap out the battery, clean the solar panel, fix broken wires, and download data. Fortunately, we managed to get it all done and return to the main road before dark. Why couldn’t we wait for a warmer day to maintain the weather station? Well, the weather station is an important NEON pilot study to determine the wind patterns at a particular site, which will inform the site layout design, orientation of the site tower and the location of sensor booms on the tower. We will measure chemicals, energy and momentum exchanges, or fluxes, between ecosystem and atmosphere using instruments mounted on towers at NEON sites. These measurements will help us better understand ecological processes – such as the movement of carbon and pollution between soil, air and water – and the drivers of those processes across the continent. Accurate turbulent wind measurement is a key measurement to enable the determination of the chemical, energy and momentum fluxes. The tower and wind sensor booms must be oriented in such a way that the prevailing winds are unimpeded by any unnatural objects, including tower infrastructure. Because wind direction can change from season to season, we require at least a full year’s wind data to confidently determine the wind patterns at a particular site. Data from the winter is equally important as data from other seasons. Based on the wind data, we can generate wind roses and conduct a footprint analysis, which will tell us the prevailing wind direction and wind speed. For the signals measured at the tower, we can also tell which direction they come from, and from what distance.
 
This kind of pilot study can help us mitigate the risk of site layout design by telling us how to optimize the location and orientation of tower structure, instrument hut, and soil array to best achieve scientific measurements. We conduct this kind of study at NEON sites like the ones in Moab and Yellowstone

Share

Related Posts:

Discontinuation of Select NEON Data Products

January 29, 2026

Modification of Select NEON Data Products

January 29, 2026

Shortwave Radiation tables temporarily removed from Summary Weather Statistics

January 12, 2026

NSF NEON, Operated by Battelle

Follow Us:

Join Our Newsletter

Get updates on events, opportunities, and how NEON is being used today.

Subscribe Now

Footer

  • About Us
  • Contact Us
  • Terms & Conditions
  • Careers
  • Code of Conduct

Copyright © Battelle, 2026

The National Ecological Observatory Network is a major facility fully funded by the U.S. National Science Foundation.

Any opinions, findings and conclusions or recommendations expressed in this material do not necessarily reflect the views of the U.S. National Science Foundation.