NSF NEON, Operated by Battelle

Main navigation

  • About
    • NEON Overview
      • Vision and Management
      • Spatial and Temporal Design
      • History
    • About the NEON Biorepository
      • ASU Biorepository Staff
      • Contact the NEON Biorepository
    • Observatory Blog
    • Newsletters
    • Staff
    • FAQ
    • Contact Us

    About

  • Data
    • Data Portal
      • Data Availability Charts
      • API & GraphQL
      • Prototype Data
      • Externally Hosted Data
    • Data Collection Methods
      • Airborne Observation Platform (AOP)
      • Instrument System (IS)
        • Instrumented Collection Types
        • Aquatic Instrument System (AIS)
        • Terrestrial Instrument System (TIS)
      • Observational System (OS)
        • Observation Types
        • Observational Sampling Design
        • Sampling Schedules
        • Taxonomic Lists Used by Field Staff
        • Optimizing the Observational Sampling Designs
      • Protocols & Standardized Methods
    • Getting Started with NEON Data
      • neonUtilities for R and Python
      • Learning Hub
      • Code Hub
    • Using Data
      • Data Formats and Conventions
      • Released, Provisional, and Revised Data
      • Data Product Bundles
      • Usage Policies
      • Acknowledging and Citing NEON
      • Publishing Research Outputs
    • Data Notifications
    • NEON Data Management
      • Data Availability
      • Data Processing
      • Data Quality

    Data

  • Samples & Specimens
    • Biorepository Sample Portal at ASU
    • About Samples
      • Sample Types
      • Sample Repositories
      • Megapit and Distributed Initial Characterization Soil Archives
    • Finding and Accessing Sample Data
      • Species Checklists
      • Sample Explorer - Relationships and Data
      • Biorepository API
    • Requesting and Using Samples
      • Loans & Archival Requests
      • Usage Policies

    Samples & Specimens

  • Field Sites
    • Field Site Map and Info
    • Spatial Layers & Printable Maps

    Field Sites

  • Resources
    • Getting Started with NEON Data
    • Research Support Services
      • Field Site Coordination
      • Letters of Support
      • Mobile Deployment Platforms
      • Permits and Permissions
      • AOP Flight Campaigns
      • Research Support FAQs
      • Research Support Projects
    • Code Hub
      • neonUtilities for R and Python
      • Code Resources Guidelines
      • Code Resources Submission
      • NEON's GitHub Organization Homepage
    • Learning Hub
      • Tutorials
      • Workshops & Courses
      • Science Videos
      • Teaching Modules
    • Science Seminars and Data Skills Webinars
    • Document Library
    • Funding Opportunities

    Resources

  • Impact
    • Research Highlights
    • Papers & Publications
    • NEON in the News

    Impact

  • Get Involved
    • Upcoming Events
    • Research and Collaborations
      • Environmental Data Science Innovation and Inclusion Lab
      • Collaboration with DOE BER User Facilities and Programs
      • EFI-NEON Ecological Forecasting Challenge
      • NEON Great Lakes User Group
      • NCAR-NEON-Community Collaborations
    • Advisory Groups
      • Science, Technology & Education Advisory Committee
      • Technical Working Groups
    • NEON Ambassador Program
      • Exploring NEON-Derived Data Products Workshop Series
    • Partnerships
    • Community Engagement
    • Work Opportunities

    Get Involved

  • My Account
  • Search

Search

About

  • NEON Overview
  • About the NEON Biorepository
  • Observatory Blog
  • Newsletters
  • Staff
  • FAQ
  • Contact Us

Breadcrumb

  1. About
  2. Observatory Blog
  3. Answer big ecological questions using big data skills

Answer big ecological questions using big data skills

May 13, 2015

NEON workshop

Interested in learning how to work with big data in R?

Sign up for A Hands-On Primer for Working with Big Data in R: Introduction to Hierarchical Data Formats, LiDAR Data & Efficient Data Visualization on Sunday August 9, 2015 at the ESA Centennial Annual Meeting in Baltimore, MD. 

Big ecological questions require big data

To ask and answer ecological questions about changes in diverse environments over large areas and long periods of time requires big data. Big data generally refer to datasets so large and complex that traditional processing applications are inadequate; however, big data present unique challenges and opportunities to the scientific research community. For example, to effectively determine the effects of development on stream water quality across a region, standardized and integrated data are needed to characterize land cover and population changes, among other things.

“Big data generally refer to massive volumes of data not readily handled by the usual data tools and practices and present unprecedented opportunities for advancing science and informing resource management through data-intensive approaches.” -Hampton et al. (2013) Big data and the future of ecology. 

Working with big data require specific skills

Working with big data in an efficient way requires a set of skills that are new to many scientists. Data formats designed to handle larger datasets, such as the hierarchical data format (HDF5):

  • Provide more efficient ways to store large datasets that might contain thousands to millions of records or hypercubes of images;
  • Allow users to store multi-dimensional and heterogeneous datasets needed to answer cross-cutting ecological questions; and
  • Provide tools to compress and/or parse data for analysis.

Data with spatial attributes

While big data formats maximize data analysis efficiency, using them involves specific sets of skills and libraries for commonly used tools like R and Python. Other data types, like remote sensing data, which include lidar and hyperspectral imagery, are necessary for measuring changes in land cover and other attributes over broad areas and through time. Working with these data that have spatial attributes requires understanding of:

  • Unique spatial and hierarchical data formats;
  • Tools and libraries required to work with data - many of which are free and open source; and
  • Metadata associated with the data, to ensure that analysis outcomes are scaled and located properly.

Automated and reproducible workflows

Working with big data require automated and reproducible workflows. Crunching through thousands or even millions of data points by hand may take weeks, months or years; repeating this type of manual analysis is difficult and time-consuming. Developing automated workflows that process data using coding tools like R or Python facilitates efficient, reproducible workflows. In addition, many journals now require submission of both data and code prior to publication.

NEON Data Skills at ESA 2015

NEON scientists Leah Wasser, Natalie Robinson, Claire Lunch, Christine Laney, Kate Thibault and Sarah Elmendorf have been building, testing, delivering and improving upon a suite of data tutorials that cover big data topics including:

  • Working with time series and spatial data stored in the HDF5 format in R
  • Learn about the HDF5 file format using a free HDF5 viewer
  • Learn key commands and libraries needed to create and work with HDF5 files in R
  • Visualization of time series data stored in HDF5 format in R
  • Working with LiDAR-derived raster data in R
  • Working with hyperspectral imagery in R

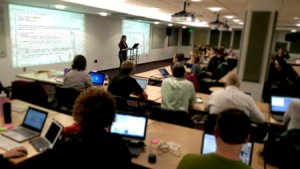
NEON is delivering this content in collaboration with SESYNC and Data Carpentry as a full-day pre-conference workshop at the 2015 ESA Annual Meeting. Learn about the half-day workshop at ESA 2014 that prompted 2015’s full-day workshop.

NEON scientists are also hosting a free lunchtime Going 'On the Grid' Spatial Data workshop on Thursday August 13, 2015. This workshop covers issues of uncertainty when converting vector point data to raster or gridded formats. As scientists, many of the observation data we work with are for specific point locations on the ground. However, we often want to interpolate our observations continuously across larger areas, a process sometimes called “gridding”. NEON will lead a discussion and live demonstration that explains how different gridding methods can yield different results in the output rasters--and more importantly, how that might impact the results of your data analysis.


Share

Related Posts:

Battelle NEON at AGU 2025

November 24, 2025

AGU logo

Version 1.2.0 of neonutilities Python package released

October 29, 2025

Resolved: Bug affecting neonUtilities in latest RStudio version on Windows

October 3, 2025

NSF NEON, Operated by Battelle

Follow Us:

Join Our Newsletter

Get updates on events, opportunities, and how NEON is being used today.

Subscribe Now

Footer

  • About Us
  • Contact Us
  • Terms & Conditions
  • Careers
  • Code of Conduct

Copyright © Battelle, 2026

The National Ecological Observatory Network is a major facility fully funded by the U.S. National Science Foundation.

Any opinions, findings and conclusions or recommendations expressed in this material do not necessarily reflect the views of the U.S. National Science Foundation.