
Tutorial
Soil temperature and moisture controls on soil microbial biomass
Last Updated: Aug 18, 2026
Soil microbial biomass is the mass of bacteria and fungi in the soil and although it is a relatively small component of soil organic matter, these microbes play a major role in several ecosystem processes, including decomposition, nutrient cycling, and soil carbon stabilization. There are many ways to measure microbial biomass and NEON uses the amount of phospholipid fatty acids (PLFAs) in the soil because they turn over quickly making them a good proxy for the amount of living microbial mass. Many factors are known to influence soil microbial biomass, such as soil organic carbon content, vegetation type and litter inputs, soil type, and abiotic conditions, such as temperature and water availability. In this tutorial we'll investigate the relationship between soil microbial biomass and soil temperature and moisture at one NEON site. This will involve downloading NEON data, combining data from different NEON data products, filtering out suspect data, and exploring the microbial biomass relationship with soil temperature and moisture. We'll be using two different NEON data products:
- DP1.10104.001, Soil microbe biomass
- DP1.10086.001, Soil physical and chemical properties, periodic
Soil microbial biomass and corresponding soil sample temperature and moisture are measured in ten plots at each NEON terrestrial site one to three times per year, with each site always sampled during the historic peak in vegetation greenness and sometimes sampled during other seasons or seasonal transitions.
We will be using data from the Guanica Forest (GUAN) site in Puerto Rico. The site is in a subtropical dry zone along the southern coast of Puerto Rico characterized by low annual rainfall averaging 840 mm and high evapotranspiration. Given that temperatures are warm and fairly stable at this subtropical site and precipitation is relatively low, we might expect to see a stronger relationship between microbial biomass and soil moisture than with soil temperature, so let's see what the data show.
Things You’ll Need To Complete This Tutorial
- You will need a current version of R (4+) and preferably RStudio loaded on your computer to complete this tutorial.
- Create a NEON user account
- Generate an API token for downloading data
1. Setup
Start by installing (if necessary) and loading the neonUtilities package. Installation can be run once, then periodically to get package updates.
As of June 2026, NEON requires an API token for data downloads, to reduce bot scraping and improve user support. Tokens can be generated in NEON data portal user accounts - log in to your account or create one, and go to the API Tokens section. For best practices in storing and using tokens, follow the instructions here.
install.packages("neonUtilities")

install.packages("neonOS")

install.packages("dplyr")

install.packages("ggplot2")
Now load the package and read in your token. This needs to be done every time you run code.
library(dplyr)

library(ggplot2)

library(neonUtilities)

library(neonOS)

token <- Sys.getenv("NEON_TOKEN")
2. Download the data
Download the soil microbial biomass and soil properties
data using the loadByProduct() function in the neonUtilities package. Inputs
needed for the function are:
-
dpID: data product ID; soil microbe biomass = DP1.10104.001 (or soil properties, periodic = DP1.10086.001) -
site: (vector of) 4-letter site codes; Guanica Forest = GUAN -
release: data release to download; we'll use RELEASE-2024 -
check.size: should this function prompt the user with an estimated download size? Set toFALSEhere for ease of processing as a script, but good to leave as defaultTRUEwhen downloading a dataset for the first time. -
token: Your NEON API token
Since microbial biomass is only measured a few times per year in ten plots the amount of data is relatively small so we'll download all available data by not specifying start and end dates. Refer to the cheat sheet
for more details on the neonUtilities package.
microb <- loadByProduct(dpID = "DP1.10104.001",
                        site = "GUAN",
                        release = "RELEASE-2024",
                        check.size = F,
                        token=token)


soil <- loadByProduct(dpID = "DP1.10086.001",
                      site = "GUAN",
                      release = "RELEASE-2024",
                      check.size = F,
                      token=token)


list2env(microb, .GlobalEnv)

list2env(soil, .GlobalEnv)
3. Exploring the data
First let's take a look at the microbial data that we downloaded, which is a list of seven tables but we're just going to use two of them: sme_scaledMicrobialBiomass and variables_10104. We can use the head() function to get a sense of what the data look like. There are a lot of columns corresponding to a range of different lipids that might be detected in the phospholipid fatty acid (PLFA) analysis, but we're primarily interested in total microbial biomass as indicated by total lipid concentration (totalLipidConcentration). We can also see that at least some of the extractions might not have worked correctly as indicated by the analysisResultsQF column, so we'll want to filter those out later.
# View the first few rows of the microbial biomass table
head(sme_scaledMicrobialBiomass)
## uid namedLocation domainID siteID decimalLatitude decimalLongitude
## 1 faf0345b-6c99-4291-97b8-3158469824bc GUAN_002.basePlot.bgc D04 GUAN 17.97029 -66.82463
## 2 852db0ae-21d0-427d-a850-a1053b30169f GUAN_002.basePlot.bgc D04 GUAN 17.97029 -66.82463
## 3 4ef91e2c-eb2e-4522-9145-0f1e2e2dbf84 GUAN_002.basePlot.bgc D04 GUAN 17.97029 -66.82463
## 4 903d0136-5615-49e2-9d15-40c534bab370 GUAN_001.basePlot.bgc D04 GUAN 17.97277 -66.85124
## 5 dd6062fa-a2a8-446a-a44e-8125071fb4d7 GUAN_001.basePlot.bgc D04 GUAN 17.97277 -66.85124
## 6 672b7109-c653-441f-863a-429ff0d22842 GUAN_001.basePlot.bgc D04 GUAN 17.97277 -66.85124
## geodeticDatum coordinateUncertainty elevation elevationUncertainty plotID collectDate
## 1 WGS84 20.10 86.6 0.1 GUAN_002 2018-09-24 12:43:00
## 2 WGS84 20.10 86.6 0.1 GUAN_002 2018-09-24 13:25:00
## 3 WGS84 20.10 86.6 0.1 GUAN_002 2018-09-24 13:46:00
## 4 WGS84 20.13 149.5 0.1 GUAN_001 2018-09-24 15:35:00
## 5 WGS84 20.13 149.5 0.1 GUAN_001 2018-09-24 16:05:00
## 6 WGS84 20.13 149.5 0.1 GUAN_001 2018-09-24 16:26:00
## freezeDryMass freezeDryDate analysisDate processedDate laboratoryName sampleID
## 1 7.63 <NA> <NA> 2020-07-16 Microbial ID, Inc GUAN_002-M-3.5-32-20180924
## 2 8.29 <NA> <NA> 2020-10-12 Microbial ID, Inc GUAN_002-M-5-13-20180924
## 3 7.37 <NA> <NA> 2020-10-12 Microbial ID, Inc GUAN_002-M-38-12.5-20180924
## 4 13.62 <NA> <NA> 2020-10-12 Microbial ID, Inc GUAN_001-M-35-28.5-20180924
## 5 14.45 <NA> <NA> 2020-07-16 Microbial ID, Inc GUAN_001-M-7-21-20180924
## 6 12.57 <NA> <NA> 2020-10-12 Microbial ID, Inc GUAN_001-M-2.5-6-20180924
## sampleCode biomassID internalLabID batchID testProtocolVersion
## 1 A00000038797 GUAN_002-M-3.5-32-20180924-BM MI200709-1301 44 Midi_PLFA_SOP_v1
## 2 A00000038798 GUAN_002-M-5-13-20180924-BM MI200915-2134 77 Midi_PLFA_SOP_v2
## 3 A00000038799 GUAN_002-M-38-12.5-20180924-BM MI200915-2133 77 Midi_PLFA_SOP_v2
## 4 A00000038802 GUAN_001-M-35-28.5-20180924-BM MI200915-2132 77 Midi_PLFA_SOP_v2
## 5 A00000038800 GUAN_001-M-7-21-20180924-BM MI200709-1300 44 Midi_PLFA_SOP_v1
## 6 A00000038801 GUAN_001-M-2.5-6-20180924-BM MI200915-2131 77 Midi_PLFA_SOP_v2
## c8To0ScaledConcentration c10To0ScaledConcentration c11To0ScaledConcentration
## 1 NA 0 0
## 2 NA 0 0
## 3 NA 0 0
## 4 NA 0 0
## 5 NA 0 0
## 6 NA 0 0
## lipid2OH10To0ScaledConcentration c12To0ScaledConcentration c13To0ScaledConcentration
## 1 0 0.58 0
## 2 0 0.52 0
## 3 0 0.65 0
## 4 0 0.00 0
## 5 0 0.25 0
## 6 0 0.00 0
## lipid2OH12To0ScaledConcentration lipid3OH12To0ScaledConcentration c14To1ScaledConcentration
## 1 NA NA 0
## 2 NA NA 0
## 3 NA NA 0
## 4 NA NA 0
## 5 NA NA 0
## 6 NA NA 0
## c14To0ScaledConcentration i14To0ScaledConcentration i15To0ScaledConcentration aC15To0ScaledConcentration
## 1 2.69 3.79 19.17 7.23
## 2 1.76 1.81 13.20 5.58
## 3 3.00 1.91 18.23 5.72
## 4 1.28 0.96 11.20 4.05
## 5 1.34 1.51 11.97 4.25
## 6 1.12 1.12 11.85 4.14
## c15To0ScaledConcentration c15To1ScaledConcentration lipid2OH14To0ScaledConcentration
## 1 1.77 0 NA
## 2 1.44 0 NA
## 3 2.08 0 NA
## 4 0.83 0 NA
## 5 0.82 0 NA
## 6 0.75 0 NA
## lipid3OH14To0ScaledConcentration i16To0ScaledConcentration cis16To1n9ScaledConcentration
## 1 NA 13.82 8.24
## 2 NA 11.44 5.37
## 3 NA 12.05 8.67
## 4 NA 7.08 5.42
## 5 NA 6.40 5.64
## 6 NA 6.70 5.28
## c16To1n7ScaledConcentration c16To1Cis11ScaledConcentration c16To0ScaledConcentration
## 1 NA 6.76 43.00
## 2 NA 4.58 33.01
## 3 NA 6.27 49.23
## 4 NA 3.25 21.17
## 5 NA 4.60 21.81
## 6 NA 3.49 19.72
## lipid10Methyl16To0ScaledConcentration i17To0ScaledConcentration c17To1ScaledConcentration
## 1 32.25 10.23 0
## 2 25.39 8.75 0
## 3 32.55 9.63 0
## 4 23.04 5.69 0
## 5 23.63 5.31 0
## 6 22.23 5.33 0
## cyclo17To0ScaledConcentration c17To0ScaledConcentration c17To0AnteisoScaledConcentration
## 1 4.57 2.31 8.39
## 2 2.51 1.82 8.18
## 3 4.70 2.49 6.84
## 4 3.79 1.05 4.52
## 5 3.12 1.09 4.00
## 6 3.21 1.04 4.05
## c17To1n7ScaledConcentration lipid2OH16To0ScaledConcentration lipid10Methyl17To0ScaledConcentration
## 1 NA 0 1.56
## 2 NA 0 1.25
## 3 NA 0 1.43
## 4 NA 0 0.83
## 5 NA 0 0.69
## 6 NA 0 0.78
## lipid10Methyl17To1ScaledConcentration c18To1n13ScaledConcentration c18To3n6ScaledConcentration
## 1 NA NA 0
## 2 NA NA 0
## 3 NA NA 0
## 4 NA NA 0
## 5 NA NA 0
## 6 NA NA 0
## cis18To2n912ScaledConcentration cis18To1n9ScaledConcentration trans18To1n9ScaledConcentration
## 1 5.94 16.55 NA
## 2 4.23 16.21 NA
## 3 7.71 20.09 NA
## 4 1.45 7.11 NA
## 5 1.38 8.22 NA
## 6 0.89 6.89 NA
## trans18To2n912ScaledConcentration c18To3n3ScaledConcentration c18To1n11ScaledConcentration
## 1 NA NA 19.02
## 2 NA NA 13.02
## 3 NA NA 21.22
## 4 NA NA 9.16
## 5 NA NA 10.11
## 6 NA NA 7.31
## c18To0ScaledConcentration lipid10Methyl18To0ScaledConcentration lipid10Methyl18To1ScaledConcentration
## 1 NA 6.61 NA
## 2 NA 5.88 NA
## 3 NA 5.80 NA
## 4 NA 3.30 NA
## 5 NA 3.53 NA
## 6 NA 3.84 NA
## cyclo19To0ScaledConcentration c19To1Cis10ScaledConcentration c20To4n6ScaledConcentration
## 1 44.34 NA 1.21
## 2 38.84 NA 0.60
## 3 63.43 NA 1.15
## 4 15.82 NA 0.42
## 5 18.57 NA 0.40
## 6 16.93 NA 0.29
## c20To5n3ScaledConcentration c20To3n6ScaledConcentration c20To2ScaledConcentration c20To1ScaledConcentration
## 1 0.22 0.36 0 1.31
## 2 0.00 0.00 0 0.76
## 3 0.29 0.25 0 1.44
## 4 0.00 0.14 0 0.61
## 5 0.00 0.12 0 0.68
## 6 0.00 0.00 0 0.52
## c20To3n3ScaledConcentration c20To0ScaledConcentration c21To0ScaledConcentration c22To2ScaledConcentration
## 1 NA 1.11 0 0
## 2 NA 1.38 0 0
## 3 NA 2.41 0 0
## 4 NA 0.52 0 0
## 5 NA 0.41 0 0
## 6 NA 0.44 0 0
## c22To1n9ScaledConcentration c22To0ScaledConcentration c22To6CisScaledConcentration
## 1 0 0.53 0
## 2 0 1.41 0
## 3 0 2.28 0
## 4 0 0.46 0
## 5 0 0.24 0
## 6 0 0.48 0
## c23To0ScaledConcentration c24To1ScaledConcentration c24To0ScaledConcentration totalLipidScaledConcentration
## 1 0.35 0 0.66 264.57
## 2 0.25 0 2.08 211.29
## 3 0.84 0 2.85 295.21
## 4 0.00 0 0.42 133.57
## 5 0.00 0 0.26 140.32
## 6 0.00 0 0.37 128.78
## lipidInternalStandardID lipidInternalStandardConcentration lipidInternalStandardResponse
## 1 <NA> NA NA
## 2 <NA> NA NA
## 3 <NA> NA NA
## 4 <NA> NA NA
## 5 <NA> NA NA
## 6 <NA> NA NA
## processedBy reviewedBy remarks analysisResultsQF dataQF publicationDate
## 1 X3dKIAlqROSj6yvdqziKsQ== ujgT9aJ6r0v1tDEzqHQgRg== <NA> OK <NA> 20231228T192405Z
## 2 X3dKIAlqROSj6yvdqziKsQ== R4/UGDekA77/irTWzC9I3x3ZBDsojeHY <NA> OK <NA> 20231228T192405Z
## 3 X3dKIAlqROSj6yvdqziKsQ== R4/UGDekA77/irTWzC9I3x3ZBDsojeHY <NA> OK <NA> 20231228T192405Z
## 4 X3dKIAlqROSj6yvdqziKsQ== R4/UGDekA77/irTWzC9I3x3ZBDsojeHY <NA> OK <NA> 20231228T192405Z
## 5 X3dKIAlqROSj6yvdqziKsQ== ujgT9aJ6r0v1tDEzqHQgRg== <NA> OK <NA> 20231228T192405Z
## 6 X3dKIAlqROSj6yvdqziKsQ== R4/UGDekA77/irTWzC9I3x3ZBDsojeHY <NA> OK <NA> 20231228T192405Z
## release
## 1 RELEASE-2024
## 2 RELEASE-2024
## 3 RELEASE-2024
## 4 RELEASE-2024
## 5 RELEASE-2024
## 6 RELEASE-2024
There is known contamination of lipid c18To0 from the Buyer and Sasser high-throughput PLFA method that comes from the solid phase extraction 96 well plates used. Prior to November 2021 this lipid was excluded from the results and no correction to the total lipid concentration data is necessary, however, since then c18To0 has been reported in the data and needs to be subtracted from the total lipid concentration to get a reliable estimate of microbial biomass. Note that an alternative approach to correcting the total lipid concentration data is to perform a blank correction based on lipid concentrations reported in blanks in the sme_batchResults table.
sme_scaledMicrobialBiomass <- sme_scaledMicrobialBiomass |>
  mutate(correctedTotLipidConc = ifelse(is.na(c18To0ScaledConcentration),
                                        totalLipidScaledConcentration,
                                        totalLipidScaledConcentration - c18To0ScaledConcentration))
To find the units of the total lipid concentration data we can use the variables_10104 table, which provides information about each column in the data product. The units are nanomoles of lipids per gram of soil.
variables_10104 |>
  filter(fieldName=="totalLipidConcentration") |>
  select(description, units)

##                                                                                    description
##                                                                                         <char>
## 1: Total lipid concentration calculated as the sum of all measured individual lipid components
##               units
##              <char>
## 1: nanomolesPerGram
Next let's look at the soil properties data, which contains 14 tables but we'll just use three of them: sls_soilCoreCollection which includes soil temperature at the time of sampling, sls_soilMoisture, and lastly variables_10086 to identify the measurement units.
# View the first few rows of the soil core table, which includes soil temperature
head(sls_soilCoreCollection)
## uid domainID siteID plotID namedLocation plotType
## 1 7cdba53b-fd54-4cee-b004-40172a4bf1fd D04 GUAN GUAN_005 GUAN_005.basePlot.bgc distributed
## 2 3375cf36-12c1-4b14-8fec-22be2b25138e D04 GUAN GUAN_005 GUAN_005.basePlot.bgc distributed
## 3 24573ba0-226b-4584-947b-a47d9a1fe17a D04 GUAN GUAN_005 GUAN_005.basePlot.bgc distributed
## 4 dcf8c867-a596-4ccc-a903-fa600717005d D04 GUAN GUAN_006 GUAN_006.basePlot.bgc distributed
## 5 b8a1a6d6-09ac-4543-967d-c96bf4cc6aad D04 GUAN GUAN_006 GUAN_006.basePlot.bgc distributed
## 6 2b2b3136-a5ec-498a-b6d5-46f464cea7a9 D04 GUAN GUAN_006 GUAN_006.basePlot.bgc distributed
## nlcdClass subplotID coreCoordinateX coreCoordinateY geodeticDatum decimalLatitude decimalLongitude
## 1 evergreenForest <NA> 35.5 28.5 WGS84 17.96874 -66.88045
## 2 evergreenForest <NA> 35.5 28.5 WGS84 17.96874 -66.88045
## 3 evergreenForest <NA> 31.0 2.0 WGS84 17.96874 -66.88045
## 4 evergreenForest <NA> 31.0 9.5 WGS84 17.96382 -66.87567
## 5 evergreenForest <NA> 31.0 9.5 WGS84 17.96382 -66.87567
## 6 evergreenForest <NA> 38.5 31.5 WGS84 17.96382 -66.87567
## coordinateUncertainty elevation elevationUncertainty samplingProtocolVersion startDate
## 1 20.2 164.3 0.24 NEON.DOC.014048vE 2015-08-11 12:52:00
## 2 20.2 164.3 0.24 NEON.DOC.014048vE 2015-08-11 12:52:00
## 3 20.2 164.3 0.24 NEON.DOC.014048vE 2015-08-11 14:24:00
## 4 20.1 98.9 0.19 NEON.DOC.014048vE 2015-08-14 12:28:00
## 5 20.1 98.9 0.19 NEON.DOC.014048vE 2015-08-14 12:28:00
## 6 20.1 98.9 0.19 NEON.DOC.014048vE 2015-08-14 13:23:00
## collectDate sampleTiming biophysicalCriteria eventID standingWaterDepth nTransBoutType
## 1 2015-08-11 12:52:00 peakGreenness <NA> <NA> 0 No
## 2 2015-08-11 12:52:00 peakGreenness <NA> <NA> 0 No
## 3 2015-08-11 14:24:00 peakGreenness <NA> <NA> 0 No
## 4 2015-08-14 12:28:00 peakGreenness <NA> <NA> 0 No
## 5 2015-08-14 12:28:00 peakGreenness <NA> <NA> 0 No
## 6 2015-08-14 13:23:00 peakGreenness <NA> <NA> 0 No
## boutType samplingImpractical incubationMethod incubationCondition sampleID
## 1 biogeochemistry <NA> no incubation <NA> GUAN_005-M-35.5-28.5-20150811
## 2 biogeochemistry <NA> no incubation <NA> GUAN_005-O-35.5-28.5-20150811
## 3 biogeochemistry <NA> no incubation <NA> GUAN_005-M-31-2-20150811
## 4 biogeochemistry <NA> no incubation <NA> GUAN_006-O-31-9.5-20150814
## 5 biogeochemistry <NA> no incubation <NA> GUAN_006-M-31-9.5-20150814
## 6 biogeochemistry <NA> no incubation <NA> GUAN_006-M-38.5-31.5-20150814
## sampleCode toxicodendronPossible horizon horizonDetails soilTemp litterDepth sampleTopDepth
## 1 <NA> <NA> M <NA> 26.7 4 1.5
## 2 <NA> <NA> O <NA> 26.7 4 0.0
## 3 <NA> <NA> M <NA> 28.2 5 0.0
## 4 <NA> <NA> O <NA> 28.0 8 0.0
## 5 <NA> <NA> M <NA> 28.0 8 1.8
## 6 <NA> <NA> M <NA> 28.5 3 0.2
## sampleBottomDepth sampleExtent soilSamplingDevice soilCoreCount geneticSampleID geneticSampleCode
## 1 17.0 <NA> <NA> 2 <NA> <NA>
## 2 1.5 <NA> <NA> 2 <NA> <NA>
## 3 13.0 <NA> <NA> 1 <NA> <NA>
## 4 1.8 <NA> <NA> 1 <NA> <NA>
## 5 9.0 <NA> <NA> 1 <NA> <NA>
## 6 29.0 <NA> <NA> 1 <NA> <NA>
## geneticSampleCondition geneticSamplePrepMethod geneticArchiveSample1ID geneticArchiveSample1Code
## 1 <NA> <NA> <NA> <NA>
## 2 <NA> <NA> <NA> <NA>
## 3 <NA> <NA> <NA> <NA>
## 4 <NA> <NA> <NA> <NA>
## 5 <NA> <NA> <NA> <NA>
## 6 <NA> <NA> <NA> <NA>
## geneticArchiveSample2ID geneticArchiveSample2Code geneticArchiveSample3ID geneticArchiveSample3Code
## 1 <NA> <NA> <NA> <NA>
## 2 <NA> <NA> <NA> <NA>
## 3 <NA> <NA> <NA> <NA>
## 4 <NA> <NA> <NA> <NA>
## 5 <NA> <NA> <NA> <NA>
## 6 <NA> <NA> <NA> <NA>
## geneticArchiveSample4ID geneticArchiveSample4Code geneticArchiveSample5ID geneticArchiveSample5Code
## 1 <NA> <NA> <NA> <NA>
## 2 <NA> <NA> <NA> <NA>
## 3 <NA> <NA> <NA> <NA>
## 4 <NA> <NA> <NA> <NA>
## 5 <NA> <NA> <NA> <NA>
## 6 <NA> <NA> <NA> <NA>
## geneticArchiveSamplePrepMethod geneticArchiveContainer biomassID biomassCode biomassSampleCondition
## 1 <NA> <NA> <NA> <NA> <NA>
## 2 <NA> <NA> <NA> <NA> <NA>
## 3 <NA> <NA> <NA> <NA> <NA>
## 4 <NA> <NA> <NA> <NA> <NA>
## 5 <NA> <NA> <NA> <NA> <NA>
## 6 <NA> <NA> <NA> <NA> <NA>
## remarks
## 1 We were not able to reach a depth of 30 cm, soil was collected at the depth that the core was able to reach.
## 2 <NA>
## 3 Not able to reach 30 cm depth when sampling.
## 4 <NA>
## 5 We were not able to reach 30 cm with coring device due to the obstruction of rocks.
## 6 <NA>
## collectedBy dataQF publicationDate release
## 1 jaceituno@field-ops.org legacyData 20231226T233738Z RELEASE-2024
## 2 jaceituno@field-ops.org legacyData 20231226T233738Z RELEASE-2024
## 3 jaceituno@field-ops.org legacyData 20231226T233738Z RELEASE-2024
## 4 jaceituno@field-ops.org legacyData 20231226T233738Z RELEASE-2024
## 5 jaceituno@field-ops.org legacyData 20231226T233738Z RELEASE-2024
## 6 jaceituno@field-ops.org legacyData 20231226T233738Z RELEASE-2024
# View the first few rows of the soil moisture table
head(sls_soilMoisture)
## uid domainID siteID plotID namedLocation startDate
## 1 b485f423-4075-4c53-a243-c6024995a826 D04 GUAN GUAN_005 GUAN_005.basePlot.bgc 2015-08-11 12:52:00
## 2 0d41f81a-6477-4fe8-a2aa-0995f2ce6b0e D04 GUAN GUAN_005 GUAN_005.basePlot.bgc 2015-08-11 12:52:00
## 3 e5fe378a-57e7-42a3-aa4e-0d45e32be776 D04 GUAN GUAN_005 GUAN_005.basePlot.bgc 2015-08-11 14:24:00
## 4 b6307a37-b72c-443b-9075-ef18745f857c D04 GUAN GUAN_006 GUAN_006.basePlot.bgc 2015-08-14 12:28:00
## 5 d33d060e-4667-47e5-b2ef-b778a94f5c9c D04 GUAN GUAN_006 GUAN_006.basePlot.bgc 2015-08-14 12:28:00
## 6 b04f4770-b6fe-4b8e-bc74-8a3016ec4646 D04 GUAN GUAN_006 GUAN_006.basePlot.bgc 2015-08-14 13:23:00
## collectDate sampleID sampleCode moistureSampleID
## 1 2015-08-11 12:52:00 GUAN_005-O-35.5-28.5-20150811 <NA> GUAN_005-O-35.5-28.5-20150811-SM
## 2 2015-08-11 12:52:00 GUAN_005-M-35.5-28.5-20150811 <NA> GUAN_005-M-35.5-28.5-20150811-SM
## 3 2015-08-11 14:24:00 GUAN_005-M-31-2-20150811 <NA> GUAN_005-M-31-2-20150811-SM
## 4 2015-08-14 12:28:00 GUAN_006-O-31-9.5-20150814 <NA> GUAN_006-O-31-9.5-20150814-SM
## 5 2015-08-14 12:28:00 GUAN_006-M-31-9.5-20150814 <NA> GUAN_006-M-31-9.5-20150814-SM
## 6 2015-08-14 13:23:00 GUAN_006-O-38.5-31.5-20150814 <NA> GUAN_006-O-38.5-31.5-20150814-SM
## samplingProtocolVersion horizon ovenStartDate ovenEndDate boatMass freshMassBoatMass
## 1 NEON.DOC.014048vF O 2015-08-12 16:00:00 2015-08-14 16:47:00 1.10 6.15
## 2 NEON.DOC.014048vF M 2015-08-12 16:00:00 2015-08-14 16:50:00 1.10 11.11
## 3 NEON.DOC.014048vF M 2015-08-12 16:00:00 2015-08-14 16:51:00 1.08 11.09
## 4 NEON.DOC.014048vF O 2015-08-14 17:04:00 2015-08-17 16:00:00 1.07 6.08
## 5 NEON.DOC.014048vF M 2015-08-14 17:13:00 2015-08-17 16:00:00 1.07 11.07
## 6 NEON.DOC.014048vF O 2015-08-14 17:45:00 2015-08-17 16:00:00 1.09 6.09
## dryMassBoatMass soilMoisture dryMassFraction sampleCondition smRemarks smMeasuredBy smDataQF
## 1 5.00 0.295 0.772 <NA> <NA> <NA> legacyData
## 2 9.27 0.225 0.816 <NA> <NA> <NA> legacyData
## 3 8.24 0.398 0.715 <NA> <NA> <NA> legacyData
## 4 5.30 0.184 0.844 <NA> <NA> <NA> legacyData
## 5 9.50 0.186 0.843 <NA> <NA> <NA> legacyData
## 6 5.70 0.085 0.922 <NA> <NA> <NA> legacyData
## publicationDate release
## 1 20231226T233738Z RELEASE-2024
## 2 20231226T233738Z RELEASE-2024
## 3 20231226T233738Z RELEASE-2024
## 4 20231226T233738Z RELEASE-2024
## 5 20231226T233738Z RELEASE-2024
## 6 20231226T233738Z RELEASE-2024
We can find the units of the soil temperature and soil moisture data in variables_10086, which are °C and g water/g soil, respectively.
variables_10086 |>
  filter(fieldName=="soilTemp") |>
  select(description, units)

##                                                 description  units
##                                                      <char> <char>
## 1: In-situ temperature of soil at approximately 10 cm depth degree

variables_10086 |>
  filter(fieldName=="soilMoisture") |>
  select(description, units)

##                                                              description        units
##                                                                   <char>       <char>
## 1: Gravimetric water content of soil in grams of water per gram dry soil gramsPerGram
4. Combining the data
We have all the data we need but they are currently in several different tables that need to be combined. We'll use the joinTableNEON() function from the neonOS package to combine the tables. For more details about the neonOS package, see the neonOS tutorial.
# Merge soil moisture and soil collection data tables

soilcm <- joinTableNEON(sls_soilCoreCollection,
                        sls_soilMoisture)


# Merge soil data and microbe biomass data

swcMicrob <- joinTableNEON(soilcm,
                           sme_scaledMicrobialBiomass,
                           name1="sls_soilCoreCollection",
                           name2="sme_scaledMicrobialBiomass")
5. Microbial biomass relationship with soil temperature
Let's make a figure of the relationship between microbial biomass and soil temperature in each sampling plot. We'll subset the data to only records that passed analytical quality checks, and color the points by plot.
gg <- ggplot(subset(swcMicrob, analysisResultsQF=="OK"),
             aes(soilTemp, correctedTotLipidConc)) +
  geom_point(aes(color=plotID)) +
  xlab("Soil temperature (degrees C)") +
  ylab("Microbial biomass (nmol lipids/g soil)")

gg
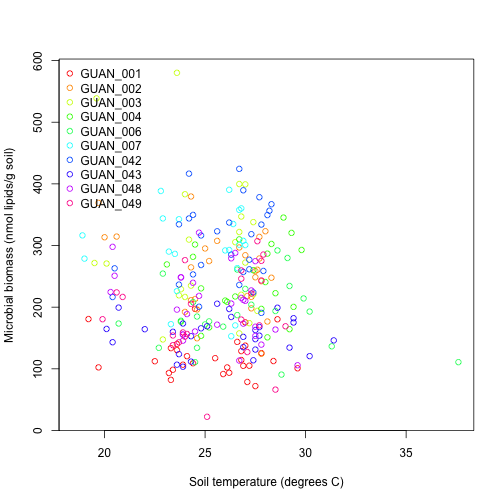
There isn't an obvious relationship between soil temperature and microbial biomass and the range in soil temperature is relatively narrow due to the subtropical location of the site.
6. Microbial biomass relationship with soil moisture
Now let's make a similar plot looking at soil moisture instead of soil temperature.
gg <- ggplot(subset(swcMicrob, analysisResultsQF=="OK"),
             aes(soilMoisture, correctedTotLipidConc)) +
  geom_point(aes(color=plotID)) +
  xlab("Soil moisture (g water / g soil)") +
  ylab("Microbial biomass (nmol lipids/g soil)")

gg
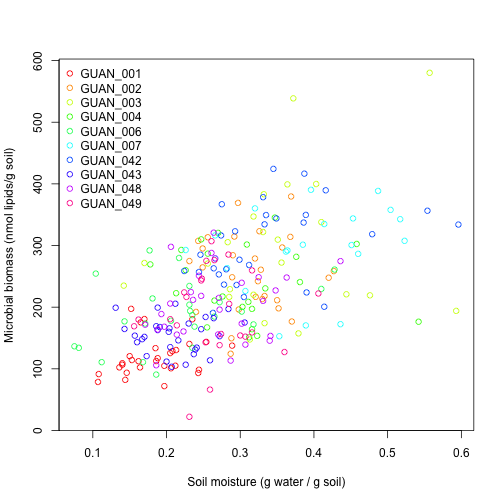
There's a lot of noise, but generally there appears to be a positive relationship between soil moisture and microbial biomass. Given the warm but relatively dry conditions at GUAN it is perhaps not surprising that microbial biomass increases when more water is available in the soil.
It is likely that many other factors besides soil temperature and moisture also influence microbial biomass. Some of these relationships could be further explored using these data products (e.g., soil pH or organic carbon content) as well as other NEON data (e.g., root biomass). In addition, NEON data from across the US could be used to identify the dominant drivers of microbial biomass in different meteorological zones.