Tutorial
Functions in Google Earth Engine (GEE)
Last Updated: Apr 2, 2026
Writing a Function to Visualize AOP Reflectance Image Collections
In the earlier Reflectance pre-processing tutorial, we showed how to read in a band of data containing weather quality information and apply cloud-masking using that band. In this tutorial, we will show you a more simplified way of doing this, using functions so we can more easily apply that operation to an Image Collection. This is called "refactoring". In any coding language, if you notice you are writing very similar lines of code repeatedly, it may be an opportunity to create a function. As you become more proficient with GEE coding, it is good practice to start writing functions to make your scripts more readable and reproducible.
Objectives
After completing this activity, you will be able to:
- Understand the basic structure of functions in GEE (JavaScript API)
- Write and call a function to read in and display images from all available years in an AOP Reflectance Image Collection
- Write a function to add the weather quality layer to the map, and mask out cloudy data from an Reflectance Image Collection
Requirements
- An Earth Engine account. You can sign up for a non-commercial Earth Engine account here: https://code.earthengine.google.com/register
- A basic understanding of the GEE code editor and the GEE JavaScript API. These are introduced in the tutorials:
- A basic understanding of hyperspectral data and the AOP hyperspectral data products. If this is your first time working with AOP hyperspectral data, we encourage you to start with the Intro to Working with Hyperspectral Remote Sensing Data in R tutorial. You do not need to follow along with the R code in those lessons, but at least read through to gain a better understanding NEON's spectral data products.
Additional Resources
If this is your first time using GEE, we recommend checking out the Google Developers website, and working through some of the introductory tutorials. The links below are good places to start.
GEE Function and Mapping Syntax
Let's get started! First let's take a look at the syntax for writing user-defined functions in GEE. If you are familiar with other programming languages, this should look somewhat familiar. The function requires input argument(s) args and returns an output. Note: Do not try to run the two code chunks below, these are just to demonstrate the key components of a function and how you can call or "map" that function.
var functionName = function(args) {
  // do something with input args
  return output;
};
To call the function for a full image collection, you can use a map to apply the function to all items in a collection. This is outlined in the code chunk below.
// Map the function over the collection.
var newVariable = collection.map(myFunction);
Read in AOP Directional Reflectance Image Collection
First, we'll read in the AOP Directional Reflectance Image Collection at Jones Center At Ichauway (JERC).
// specify center location of the site (JERC)
var site_center = ee.Geometry.Point([-84.468623,31.194839])

// read in the AOP Directional Reflectance (HSI_REFL/001) Image Collection
// filter to the site_center
var sdr_col = ee.ImageCollection('projects/neon-prod-earthengine/assets/HSI_REFL/001')
  .filterBounds(site_center)

print('NEON AOP Directional Reflectance Image Collection',sdr_col)
Cloud Masking Function
Building off the example from the previous tutorial, we can write a simple function to apply cloud-masking to an Image Collection:
// Function to mask out poor-weather data, keeping only the <10% cloud cover weather data
function clearSDR(image) {
  // create a single band Weather Quality QA layer
  var weather_qa = image.select(['Weather_Quality_Indicator']);
  // WEATHER QUALITY INDICATOR = 1 is < 10% CLOUD COVER
  var clear_qa = weather_qa.eq(1);
  // mask out all cloudy pixels from the reflectance image
  return image.updateMask(clear_qa);
}
Then we can use .map() to apply this as follows:
// Use map to apply this function on all the NISImages and return a clear-weather collection
var sdr_cloudfree = sdr_col.map(clearSDR)
Function to Add Multiple Reflectance Layers to Map
For the next example, we will write a function to add a Map Layer for each Image in an Image collection. We'll provide the full script below, including the function addNISImage, with comments explaining what each part of the function does. Note that a helpful troubleshooting technique is to add in print statements if you are unsure what the code is returning. We have included some commented-out print statements in the function, which show the outputs (which would show up in the console tab).
For a little more detail on how this function was applied, refer to this GIS Stack Exchange Post: Add/display all images of my collection in google earth engine. When writing your own GEE code, the Google earth-engine developers pages may not always have an example of what you are trying to do, so stack overflow can be a valuable resource.
// Define visualization parameters for the reflectance data, showing a true-color image
// B053 ~ 642 nm, B035 ~ 552 nm , B019 ~ 472nm
var sdr_vis_params = {'min':0, 'max':1200, 'gamma': 0.9, 'bands': ['B053','B035','B019']};
// Function to display each NIS Image in the NEON AOP Image Collection
function addNISImage(image) {
// get the system:id and convert to string
var imageId = ee.Image(image.id);
// get the system:id - this is an object on the server
var sysID_serverObj = ee.String(imageId.get("system:id"));
// getInfo() converts to string on the server
var sysID_serverStr = sysID_serverObj.getInfo()
// truncate the string to show only the fileName (NEON domain + site code + product code + year)
var fileName = sysID_serverStr.slice(51,100);
// print("fileName: "+fileName) // optionally print the file name, can uncomment
// add this layer to the map using the true-color (RGB) visualization parameters
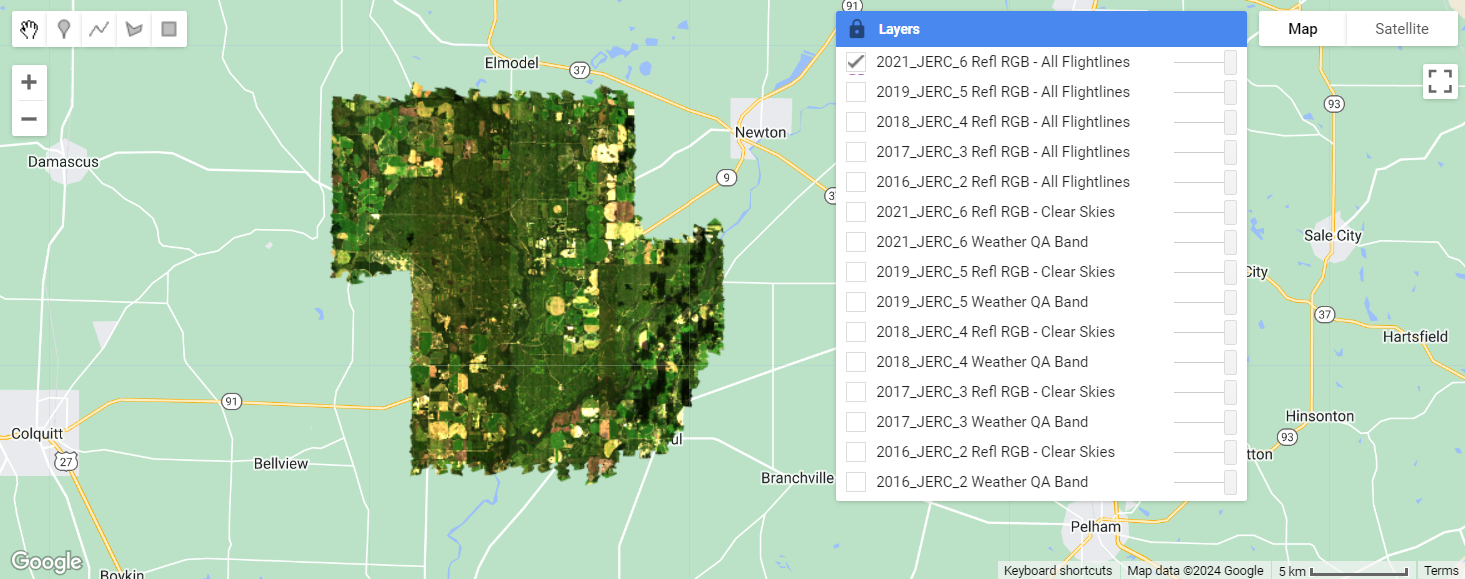
Map.addLayer(imageId, sdr_vis_params, fileName + ' Refl RGB - All Flightlines')
}
// call the addNISimages function
sdr_col.evaluate(function(sdr_col) {
sdr_col.features.map(addNISImage);
})
// Center the map on site and set zoom level (11)
Map.centerObject(site_center, 11);
Note that the first half of this function is just pulling out relevant information about the site in order to properly label the layer on the Map display. Note that defining this function alone will not display anything on the map, you will need to call (evaluate) the function.
Function including Cloud-Masking and Weather QA Layers
Next we can build upon this function to include some other pre-processing steps, such as selecting the Weather_Quality_Indicator band, and masking the reflectance data to include only the clear-weather (<10% cloud cover) data. We can add the weather QA and clear-weather masked datasets as Layers to the Map.
// Define a palette for the weather - to match NEON AOP's weather color conventions
// This will be used in the visualization parameters for the Weather QA layer
// green (<10% cloud cover), yellow (10-50% cloud cover), red (>50% cloud cover)
var gyr_palette = ['green','yellow','red']

// Build upon the function to add a layer of the weather band, and
// mask out poor-weather data (>10% cloud cover), keeping only the clear weather (<10% cloud cover)
function addClearNISImages(image) {
  // get the system:id and convert to string
  var imageId = ee.Image(image.id);
  // get the system:id - this is an object on the server
  var sysID_serverObj = ee.String(imageId.get("system:id"));
  // getInfo() converts to string on the server
  var sysID_serverStr = sysID_serverObj.getInfo()
  // truncate the string to show only the fileName (NEON domain + site code + product code + year)
  var fileName = sysID_serverStr.slice(51,100); // optionally print, can uncomment

  // create a single band Weather Quality QA layer for 2016
  var weather_qa = imageId.select(['Weather_Quality_Indicator']);

  // apply the function from the beginning of this script to generate a cloud-free image
  // you can apply a function directly on a single image in this way
  var sdr_cloudfree = clearSDR(imageId)

  // add the weather QA bands to the map with the green-yellow-red palette
  Map.addLayer(weather_qa, {min: 1, max: 3, palette: gyr_palette, opacity: 0.3}, fileName + ' Weather QA Band')

  // add the clear weather reflectance layer to the map - the 0 means the layer won't be turned on by default
  Map.addLayer(sdr_cloudfree, sdr_vis_params, fileName + ' Refl RGB - Clear Skies', 0)
}

//call the clearNISImages function
sdr_col.evaluate(function(sdr_col) {
  sdr_col.features.map(addClearNISImages);
})

// Center the map on site and set zoom level (11)
Map.centerObject(site_center, 11);
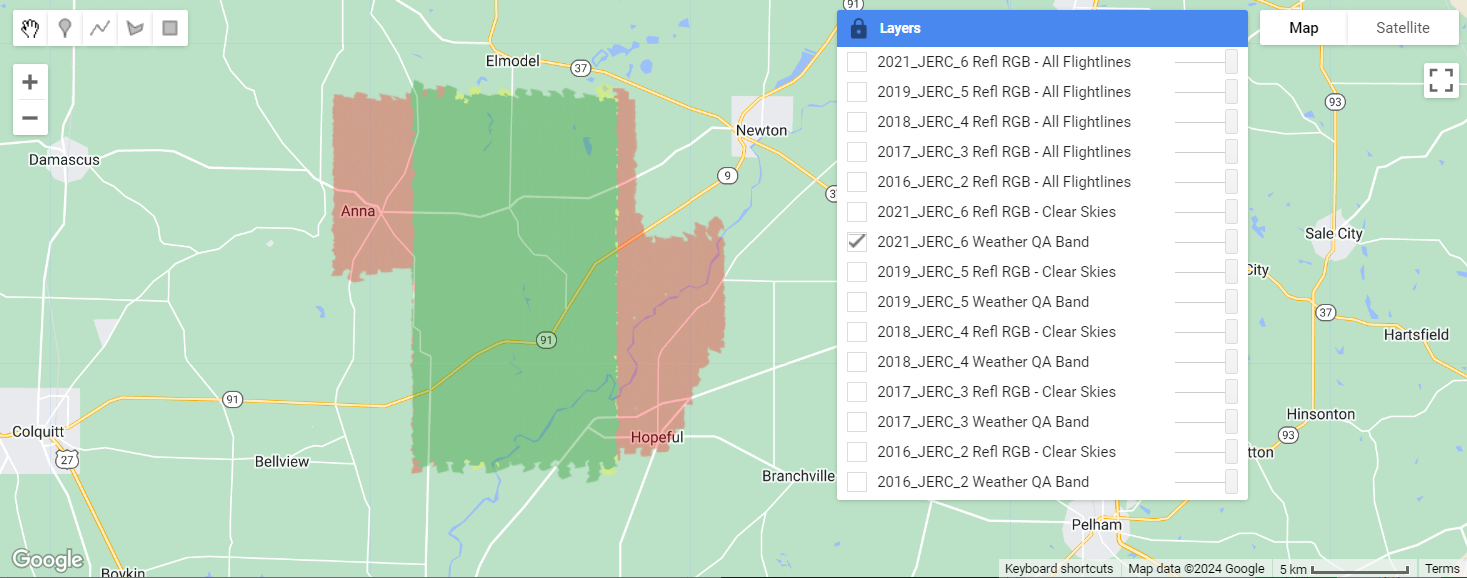
In the "Layers" tab, select and de-select the Map Layers to look at the data and the weather QA information for all of the years. This figure shows the weather quality information at JERC in 2019, where the data were collected in mixed cloud conditions. Flight operators prioritize flying the area over NEON plots in the best weather conditions when possible. As explained in the previous lesson, when working with AOP reflectance data, the weather conditions during the flights are one of the most important quality considerations.
Recap
This lesson showed how to make two functions that demonstrate using functional programming to add layers to a Map.
As explained in introduction-to-functional-programming, "Earth Engine uses a parallel processing system to carry out computation across a large number of machines...The use of for-loops is discouraged in Earth Engine. The same results can be achieved using a map() operation where you specify a function that can be independently applied to each element. This allows the system to distribute the processing to different machines." The examples presented in this lesson show how to make use of that map operation in lieu of a for loop.
Get Lesson Code
Functions to display AOP Reflectance Image Collections in GEE