Interns Summer in Review, Part 3: What's an Imaging Science student doing at NEON?
September 29, 2014
By Kevin Sacca
NEON is quite the unexpected place for an Imaging Science student to do an internship. NEON is all about Ecology, so where am I supposed to fit in here? My internship is in FIU, which is the Fundamental Instrumentation Unit. FIU is a science department whose purpose is to facilitate the instrument-based collection of abiotic terrestrial, atmospheric, and soil data in a standardized way between all of NEON’s 60 terrestrial sites.
Together with NEON’s Engineering Department, the FIU team works to determine the specifics regarding the deployment of technology and equipment (like sensors) that NEON will use to monitor the environment, and generate related data. FIU is a group of people from unique disciplines, which range from statistics to soil ecology to atmospheric science, who share NEON’s mission and want to work in the ecological sciences.
My discipline is in Imaging Science, which is the study of the “Imaging Chain.” I study how light interacts with objects, along with the engineering of imaging systems for various applications, and the analysis of images for data. It involves a ton of math, physics, engineering, computer science, and a lot of creativity.Among all the possible opportunities for work at NEON, I fit into FIU as an Image Processing Specialist. It turns out that a couple of the FIU data products come from images collected on the site towers, and then these images are processed. My job is to find the data innately held in these images and extract it so the cameras are actually taking calibrated scientific measurements by themselves.
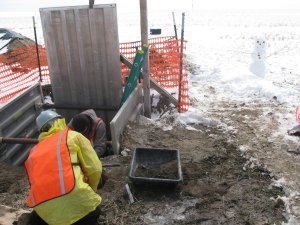
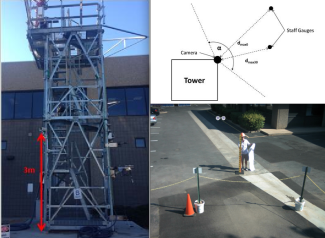
My project for the summer was a really exciting one for me to talk about because I finally worked on something where I used my knowledge of Imaging Science to develop a real and practical application. I was tasked with creating an algorithm for automatically finding snow depth using image processing techniques. I was given the type of camera that FIU scientists and NEON engineers decided to use and some base design requirements and equipment set-up specifications on the tower. These requirements are necessary for all of the data collection to be standardized. The requirements given to me included the position of the camera on the tower, the direction the camera faced, the field of view of the camera (including the error margins for horizontal, vertical, and rotational error), the amount and sizes of the staff gauges, the range of locations where a staff gauge could be placed, the resolution of the images, the quantity of images taken (including the frequency of image capture), and the acceptable measurement error the automatic snow depth algorithm must meet. All of these requirements are checked and accepted by all departments involved. This sounds like a lot of information to get thrown at you in the first few days, but the requirements and specifications were all very organized and well explained in documentation.
I had a lot of initial ideas for how I could get the data from the staff gauge in the images, and most of them involved using a different type of staff gauge pattern. The original staff gauges to be used had measurement markings that were very small, relative to the size of the gauge and the distance away from the camera. These gauges were selected because they met durability and cost needs. The camera would be using a 5.0 megapixel sensor, so there is a limit to the distance the gauge could be placed away from the tower. At a distance of around 8m, the small markings began to blur together, which made determining the snow depth difficult, even when manually interpreting the markings from an image.
So I began to think of designs for a staff gauge that could be used in more ways than one. I wanted this pattern to do the following things: allow the camera to clearly see the measurement markings, allow images to be processed using different techniques, and allow NEON staff to manually determine snow depth at a site. I also wanted the design to be a color other than white, because I knew a white gauge intended to measure snow would be difficult for an image processing algorithm to read. I settled on a colored gradient pattern.
After I developed a working algorithm for a gradient patterned gauge, I found that changing the type of staff gauge conflicted with the project requirements that had been laid out months in advance. I needed to make my method work for the existing plan. This threw the gradient-type staff gauge design, my entire approach to this point, out the window. There was no way we could change the requirements so extensively in a short amount of time. I knew that if I wanted my project to be successful, it had to work for everyone involved, not just for me or my department.
So, back to square one. I needed to come up with an algorithm that worked for an off-the-shelf stake pattern that NEON could buy in bulk. The stake also had to be durable and weather-proof for the most extreme changes in weather. I knew the algorithm I could make for the original gauges wouldn’t be effective, so I decided to test a new off-the-shelf pattern that still ensured consistency with requirements, and greatly increased the accuracy of the readings for snow depth.
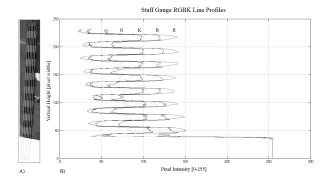
My new algorithm for the proposed gauge design is one that takes line profiles of the staff gauges. A line profile is the calculation of a pixel’s intensity, for all the pixels that fall onto a designated line segment. My algorithm takes multiple line profiles for a designated area, automatically detected by the software. These line profiles are then averaged, which reduces error dramatically, and the parts of the stake concealed by snow are interpreted as snow using statistical analysis of the line profile data.
The other important aspect of this project is to automate this process for a long time series of data. Each site will collect about 70 images per day, continuously, for 30 years. This will add up to an incredible amount of data (approximately 30,000 images/site a year). The algorithm I make has to be efficient and work for a whole folder of images at once, and produce a table of snow depth and time for each site, to be available on NEON’s data portal.
All of NEON’s data collection processes must go through a bunch of requirement checks with Engineering and each science department involved in a specific project. Engineering must be physically able to implement the designs into NEON’s site plans and NEON scientists must be satisfied with the data output. This means proposed changes can take a long time to be approved, or they may be denied for the sake of difficulty. But these are things that happen in the real world, and even though my project had a set back with the gauge pattern, I was excited by the challenge and bounced back in a big way. A good internship is supposed to provide a real-world introduction to how science is conducted in a professional environment. I’m glad for the challenges and lessons I’ve learned so far at NEON, and I know that because of this experience, I’ll have a big leg up when it comes time to finding a graduate program or a career after graduation.
I’ve learned a lot at NEON about being an Imaging Scientist in an Ecology-focused organization. The feeling you get when you are “the Imaging-Guru” in the office, or when colleagues stop by to ask real and pressing questions related to their own work, is amazing! Given NEON’s mission to standardize and automate so many high-tech instruments, an Imaging Science student fits perfectly well into this organization. Fortunately, the NEON internship was a perfect fit for me as well.
This is the third in a series of September blog posts written by our 2014 summer interns reflecting on their experiences at NEON.