Interns Summer in Review, Part 1: From the University to the Field
September 8, 2014
By Rose Petersky
During the 2013 spring semester, I registered for the Surveying for Engineers class at my college. The class was not required for my Environmental Science major, which caused my advisor to question why I would want to take it. I told him that thirteen years earlier, on a summer walk with my Mom, I saw two men on the hill above my elementary school playground. One man was looking through a large camera-like machine on a tripod and the other was holding a red pole. I asked my Mom what they were doing. She replied that they were surveying. I asked her what that meant but did not really understand her answer. I told myself that I would figure out what those people were doing, and now years later in college that was what I was planning to do.
What I did not know was that Surveying for Engineers is one of the hardest classes at SUNY College of Environmental Science and Forestry (SUNY-ESF). Not only were the lectures and labs challenging, but also everything in that class, from the measurements to the corrections, to the notes in the field book, to the final project map, had to be perfect and precise. My friends, who were taking the class for their majors, wondered why I was subjecting myself to it voluntarily. Almost every day, the class was frustrating. I wondered why I hadn’t taken Mycology instead. I thought of dropping out.
But it was a good thing I chose to stay in surveying class, because what I did in that class has been very useful for my internship at NEON. With my mentors Ryan Utz and Michael Fitzgerald, I am helping to design a protocol for mapping stream sites using surveying equipment. NEON plans to map all observatory aquatic sites once a year and the protocol must provide enough information to understand how the streams change over time. As part of my project, I traveled to NEON’s Arikaree site, which is about three hours east of Boulder by car, to map a kilometer-long reach of the Arikaree River using the protocol. The protocol is the recipe; now it was time to cook the meal.
Arikaree is in D10—the NEON Central Plains domain. This domain is sparsely populated and mostly flat from horizon to horizon. Access to unpolluted water is an issue around Arikaree due to runoff from industrialized farming. This was made clear to us when we entered our hotel in the nearby town of Burlington. After we checked in, the woman at the front desk handed us bottles of water and told us the city water is contaminated with nitrates. Demand for groundwater from the Ogallala Aquifer is causing the Arikaree River water table to subside every year. A trend that, I predict, will be clear as day on the maps that NEON will make of the site.
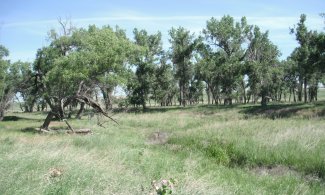
The ARIK aquatic site in Domain 10
At the NEON site, we had to map features that we could use to understand the river’s structure and environment. The most important features for us to map for this purpose were lines that followed the river bank and provided an outline of its width and direction. In addition to these features, we also collected information about the locations of features within the river such as pools and beaver dams. At the very end, we moved away from the river and collected information about the topography uphill from the river bank. This was done so we could know what the topography was like in that area. The data we collected could then be used to create a map of the river.
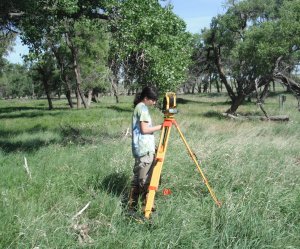
All surveying data is collected using a total station (see right). To collect data, the total station sends a laser to a prism pole, which reflects the laser back to the total station. The time that the laser takes to travel from the total station to the prism pole and then back is used to calculate the distance that the total station is from the prism pole. By repeating this process many times, information about the location of features relative to one another can be collected and used to make maps.
The elevation data that we collected was also useful. Since we knew the elevations of every point that we collected, we could use that data to estimate the elevation of any location near those points. These estimated elevations are determined using a process called “interpolation.”
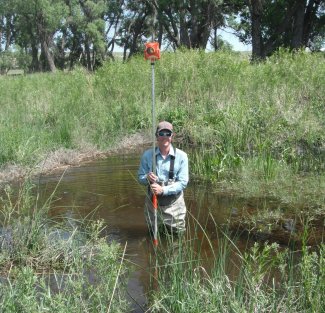
Michael Fitzgerald conducting aquatic sampling with a Prism Pole
To map the Arikaree river, I operated the total station and my mentor, Michael Fitzgerald, held the prism pole. After properly positioning the instrument, the total station sends out a laser, which is then reflected by the prism back to the total station. After a particular point was collected, I raised my hand and shouted, “Got it!” or “Done!” to Michael. He would then take the prism pole, which is more than six feet tall, and place it on the next point. If I wanted to say anything more complicated than that to Michael, I had to use a walkie-talkie. With the exception of my shouts or our radio chatter, Arikaree was a quiet, peaceful site. Sometimes, the wind blew across the plain, causing the grass and cottonwoods to sway. Occasionally, the birds chattered as they flew from tree to tree.
We collected more than a thousand points, far more than I had ever collected in class. Each section of the river took nearly a whole workday to survey and we only completed two of the seven we planned to map. What seemed like a do-able workload in my Boulder cubicle was an entirely different matter in the field. One priority for me and the NEON Aquatics team will be to see if we can change the protocol so fewer points are needed at each section. This is important because it will allow the field technicians in each of the domains to implement the protocol in less time. Since every NEON aquatics site will be measured every year, the saved time will add up and be a significant benefit for the observatory overall.
Every day children ask their parents questions that could lead them into the world of science. Some children, like me, are lucky and find their questions answered and their explorations nurtured. My journey to NEON began with child-like curiosity and a man on a hill, but it is only with the help of supportive parents, good schools, and a science-friendly environment that the mystery has been solved, an internship was gained, and the man on the hill is now me.
This is the first in a series of September blog posts written by our 2014 summer interns reflecting on their experiences at NEON.