From field notebooks to rack servers
November 15, 2013
Let me begin by saying I'm a believer in big data in ecology, and there's no more exciting place to be working right now on these problems than here at NEON.
But after just a few short weeks here, I've discovered there's a huge difference between holding a sign that says "BIG DATA NOW!" and actually building all the infrastructure it requires. I'm certainly not the first person to encounter these difficulties. Many of the great folks at NCEAS - like Mark Schildhauer, Matt Jones and others - have done lots of amazing work to build the technical tools needed to implement big data in ecology and push for adoption of these technologies (Reichman et al 2011, Michner and Jones 2012). Now that I find myself in the trenches, I want to outline some of the challenges I've encountered working here at NEON in ecoinformatics.
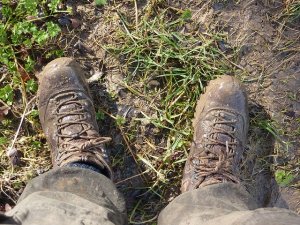
We learned with mud on our boots
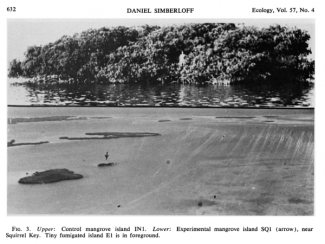
Ecology as a science comes from a tradition of what I like to call "nerdy explorers." Think the Voyage of the Beagle, think Simberloff and Wilson in the Florida Keys fumigating entire islands, think individual or small groups of researchers performing field experiments, writing down results in field notebooks and in the modern era transcribing them into spreadsheets. I'm guessing that most ecologists learned this way. The first challenge is: how do we adapt these traditional methods of the individual researcher that most of us learned to a large organization like NEON? In many ways the data collected at NEON aren't that different from what our scientific predecessors like Simberloff and Wilson collected with their famous experiment. We've got transects, binoculars, thermometers, etc., and we go out and measure all these variables at different sites. However, it's easy to oversee all of this as an individual researcher. The real challenge with NEON data collection is ensuring that we're getting high quality data not just across a small set of sites, but across almost an entire continent. So while some of the boots on the ground methods (transects, quadrats etc.) might scale up in the sense that we can just collect LOTS of them, it's a tremendous challenge to standardize them over the many and varied ecosystems of the contintental U.S.
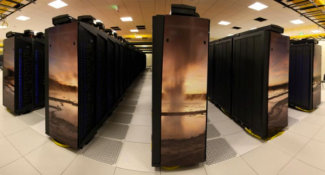
Field to Server
While one continental-scale challenge for NEON is how to collect standardized high quality data, the next challenge is what to do with it after we collect it. My own training was with Nick Gotelli as a traditional field ecologist. We would hike to remote bogs, and built experimental ponds with shovels in the woods. I managed my data in spreadsheets with informative names like "Super_Final_data.csv" and "Super_Final_dataV4.csv". Yes, there were metadata, if you count what I can remember (assuming I can remember) and write down when someone asks. Topics like data provenance, metadata, data formatting, code annotation, were just addressed idiosyncratically and haphazardly if at all. After all, my data were mine, and I knew all I needed to know about them. As the NEON scientist in charge of ecoinformatics, every day I worry about things like: "How do we make all this ecological data discoverable and useful to other researchers from different backgrounds?" and "How do we ensure that NEON data are interoperable with other data sources?" To the data-savvy outside observer it might seem like a simple solution: just make a data portal, build an API, serve up the data with metadata and call it a day. It's easy to say that, but the nuts and bolts of it are the challenge. It's sort of like saying: "You just go build a rocket ship and fly it, duh." What does that portal look like? What formats are the data in? What goes in the metadata? What is the metadata standard that you use? On top of that, let's make sure this is all scalable and sustainable for the next 30 years. Let's drill down a bit more on just one of these issues: data formats. It seems like a simple question: what format should our temperature data be delivered in? CSV? Excel? HDF5? NetCDF? People from different scientific communities are used to different data formats. An ecologist might say CSV or Excel, but an atmospheric modeler might want it in HDF5. Ok, so how do we make sure that CSV gives the same data as the HDF5? And HDF5 requires that we build a hierarchical structure for the files, so what does that structure look like? As we develop the strategies to share data at NEON, we face this issue over and over again: how do we build a scalable and sustainable data architecture that can serve a diverse user community?
Our awkward phase
One of the main reasons that we face these challenges, is that ecological science is in transition from using small-scale, individual researchers' data sets to using big data for big models. Other disciplines like atmospheric sciences figured much of this out awhile ago, but we're still in that awkward phase in ecology. We're a generation of scientists in transition. We learned with muddy boots, but we're building it into this new, high-tech data infrastructure. No doubt as new ecologists are trained, more and more of them will receive training in the informatics skills needed for using large amounts of data to answer ecological questions. Someday all these challenges I deal with every day working in informatics at NEON will seem like a distant memory. And that's really the great thing about science, isn't it: the struggles of the present pave the way for discovering things I can't even imagine in the future.