"Reproducibility is a key tenet of the scientific process that dictates the
reliability and generality of results and methods."
From Powers, S. M., and S. E. Hampton (2019),
Open science, reproducibility, and transparency in ecology (Abstract)
This lesson introduces the core principles of reproducible science in ecology and provides practical ways to apply them in your own research workflows.
In ecological science, reproducibility is especially important because observations are often context-dependent in space and time, so transparent and computationally reproducible workflows are critical for credible science, management, and policy decisions.
NEON data are especially well suited for reproducible ecological workflows because they are collected using standardized protocols across sites and time, include rich metadata and documentation, and are delivered in formats that make analyses easier to trace, rerun, and compare.
Learning Objectives
At the end of this activity, you will be able to:
Summarize the four facets of reproducibility.
Describe several ways that reproducible workflows can improve your workflow and research.
Explain several ways you can incorporate reproducible science techniques into
your own research.
Reproducible methods make science more efficient, more collaborative, and more
trustworthy across the full lifecycle of a project. Some benefits to reproducibility include:
More efficient, less redundant.
Allows for continuity in your own work over time.
Facilitates collaboration, review, and re-use by others.
Provides stronger transparency and trust in results.
What research products should be shareable?
To support reproducibility, key research products should be publicly available in
forms that others can find and understand:
Data
Code
Documentation about methods and workflow
Who needs to understand your workflow?
Collaborators
Peer reviewers and journal editors
The broader scientific community
The public
The Four Facets of Reproducibility
Reproducibility is often discussed as one idea, but in practice it has several
connected facets. Improving all four helps make your work more robust and more
useful to others.
Organization: use clear file structures, informative file names, and
explicit separation of raw, intermediate, and final outputs.
Automation: prefer scripts over point-and-click steps so analyses can be
rerun, modified, and reviewed efficiently.
Documentation: record decisions, code purpose, inputs/outputs, and
workflow steps so others (and your future self) can understand the work.
Dissemination: share data, code, and workflows in accessible repositories
and formats so others can find, evaluate, and build on your results.
In practice: You can be strong in one facet and weak in another, so reproducibility is usually a work in progress rather than an all-or-nothing goal. For example, sharing code without data provenance may limit reproducibility even when the analysis itself is well documented.
How Reproducible Workflows Improve Research
Reproducible workflows provide benefits both during a project and after
publication.
Fewer errors and faster debugging: scripted workflows make mistakes easier
to detect and fix.
Easier collaboration: shared conventions (file naming, documentation,
version control) reduce friction across teams.
More efficient updates: when data are revised, automated workflows can
rebuild results quickly.
Greater trust and re-use: transparent methods improve confidence and make
it easier for others to build on your work.
Stronger scientific impact: reproducible outputs are more likely to be
re-analyzed, cited, and used for synthesis.
Incorporating Reproducible Science Into Your Workflow
You do not need to adopt everything at once. Start with small, high-impact
changes and build over time.
Quick Wins (start this week)
Use descriptive file names and a consistent folder structure.
Keep raw data read-only; write processed outputs to separate directories.
Record software versions and package dependencies.
Add a project README with goals, inputs, and run instructions.
Next Steps (this month)
Move repeated analyses from point-and-click tools into scripts.
Use version control (for example, Git) for code and documentation.
Add lightweight quality checks for expected rows, columns, units, and ranges.
Archive analysis-ready data and scripts with a persistent identifier (DOI).
Advanced Practices (ongoing)
Build end-to-end pipelines that regenerate figures and tables.
Use computational environments (for example, containers) to
improve run-to-run consistency.
Add executable reports/notebooks that pair narrative, code, and outputs.
Include clear licensing, citation, and contribution guidance for re-use.
Practical Challenges and Tradeoffs
Adopting reproducible methods often requires more setup time at the beginning.
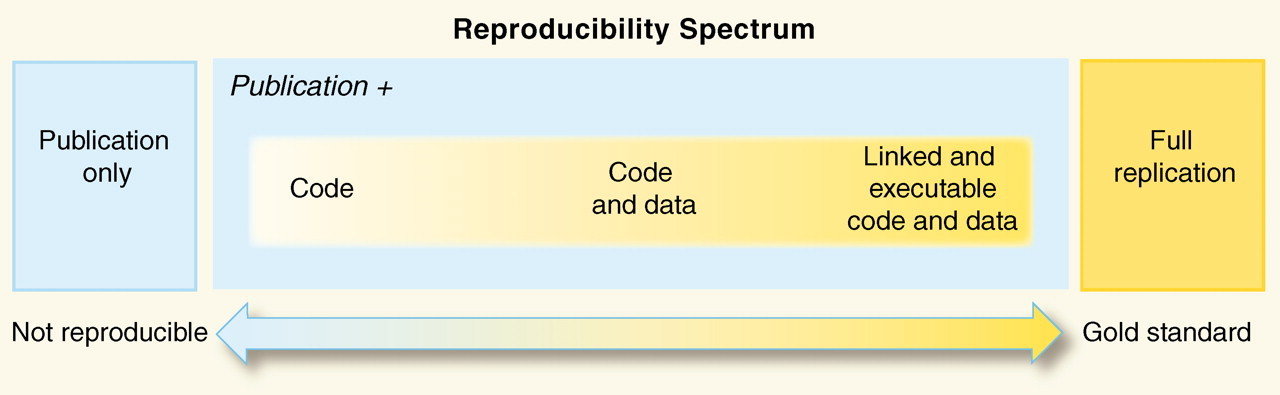
However, this up-front investment usually saves time later by making analyses easier to update, repeat, and explain. Moving towards reproducibility can be approached with a "good-better-best" framework. See the figure below to assess where your work lies on the reproducability spectrum.
Reproducibility spectrum for published research.
Source: Peng, RD Reproducible Research in Computational Science (2011): 1226–1227 via Reproducible Science Curriculum
Thought Questions: Have a look at the reproducible science check list linked above and answer the following questions:
Do you currently apply any of the items in the checklist to your research?
Are there elements in the list that you are interested in incorporating into your
workflow? If so, which ones?
Self-Check Quiz
Use this quick quiz to check your understanding of the learning objectives.
Which list matches the four facets from the NEON reproducible science slides?
A. Computation, Statistics, Visualization, Reporting
B. Organization, Automation, Documentation, Dissemination
C. Planning, Coding, Publishing, Archiving
D. Collection, Cleaning, Modeling, Interpretation
Which practice is most aligned with the Organization facet?
A. Using informative file names and a clear directory structure
B. Writing results directly over raw input data
C. Keeping steps undocumented but fast
D. Sharing only a figure in a slide deck
Why is scripting preferred over manual steps for many analyses?
A. It always requires less up-front time
B. It makes methods harder for collaborators to inspect
C. It supports efficient reruns and updates over time
D. It removes the need for version control
Which audiences may need access to your research workflow?
A. Principal investigators
B. Peer reviewers
C. Collaborators, peer reviewers/editors, the scientific community, and the public
D. Data managers
Which option best reflects the Dissemination facet?
A. Publishing ends the workflow; no further sharing is needed
B. Share data snapshots and workflows in accessible platforms (for example,
repositories and notebook-sharing tools)
C. Keep data private unless requested by email
D. Share code only if journal reviewers ask for it
Quiz Key
B
A
C
C
B
Reflection Prompts
Use these prompts for discussion, journaling, or a short assignment.
Which of the four facets is currently strongest in your workflow? Which is
weakest?
Identify one analysis step in your current project that is hard to rerun. What
single change would make it easier to reproduce?
If a collaborator joined your project tomorrow, what three artifacts (files,
notes, metadata, or scripts) would help them reproduce your results fastest?
What is one reproducibility practice you can adopt this week and one you can
adopt this month?
How might improved transparency change trust in your results for a policy,
management, or stakeholder audience?
After completing this tutorial, you will be able to:
Define hyperspectral remote sensing.
Explain the fundamental principles of hyperspectral remote sensing data.
Describe the key attributes that are required to effectively work with
hyperspectral remote sensing data in tools like R, Python, or Google Earth Engine (GEE).
Describe what a "band" is.
Define "spectral resolution" and "full width half max (FWHM)".
Mapping the Invisible
About Hyperspectral Remote Sensing Data
The electromagnetic spectrum is composed of thousands of bands representing
different types of light energy. Imaging spectrometers (instruments that collect hyperspectral data) break the electromagnetic spectrum into groups of bands that support classification of objects by their spectral properties on the earth's surface. Hyperspectral data consists of many bands -- up to hundreds of bands -- that cover a portion of the electromagnetic spectrum.
The NEON imaging spectrometer collects data within the 380nm to 2510nm portions of the electromagnetic spectrum within bands that are approximately 5nm in width. This results in a hyperspectral data cube that contains approximately 426 bands - which means big, big data.
Key Metadata for Hyperspectral Data
Bands and Wavelengths
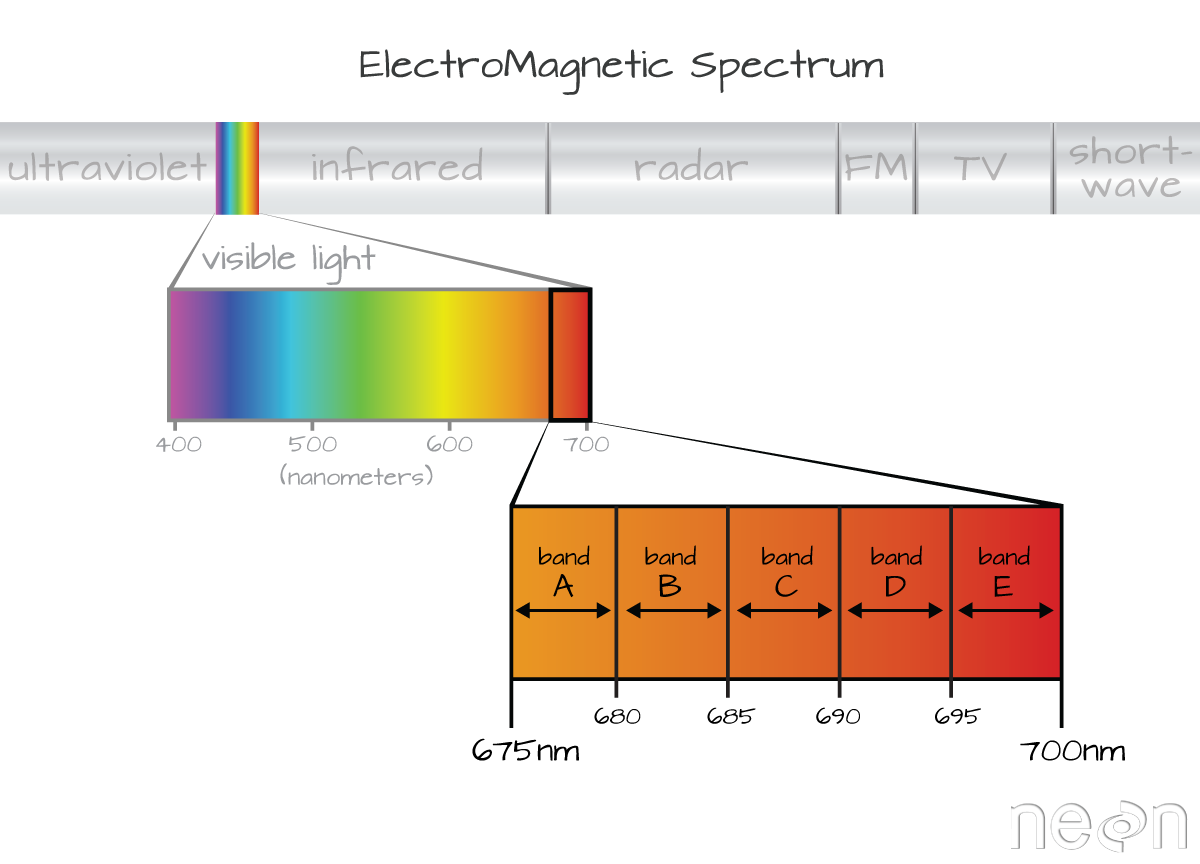
A band represents a group of wavelengths. For example, the wavelength values
between 695nm and 700nm might be one band as captured by an imaging spectrometer. The imaging spectrometer collects reflected light energy in a pixel for light in that band. Often when you work with a multi or hyperspectral dataset, the band information is reported as the center wavelength value. This value represents the center point value of the wavelengths represented in that band. Thus in a band spanning 695-700 nm, the center would be 697.5).
Imaging spectrometers collect reflected light information within defined bands or regions of the electromagnetic spectrum. Source: National Ecological Observatory Network (NEON)
Spectral Resolution
The spectral resolution of a dataset that has more than one band, refers to the width of each band in the dataset. In the example above, a band was defined as spanning 695-700nm. The width or spatial resolution of the band is thus 5 nanometers. To see an example of this, check out the band widths for the
Landsat sensors.
Full Width Half Max (FWHM)
The full width half max (FWHM) will also often be reported in a multi or
hyperspectral dataset. This value represents the spread of the band around that center point.
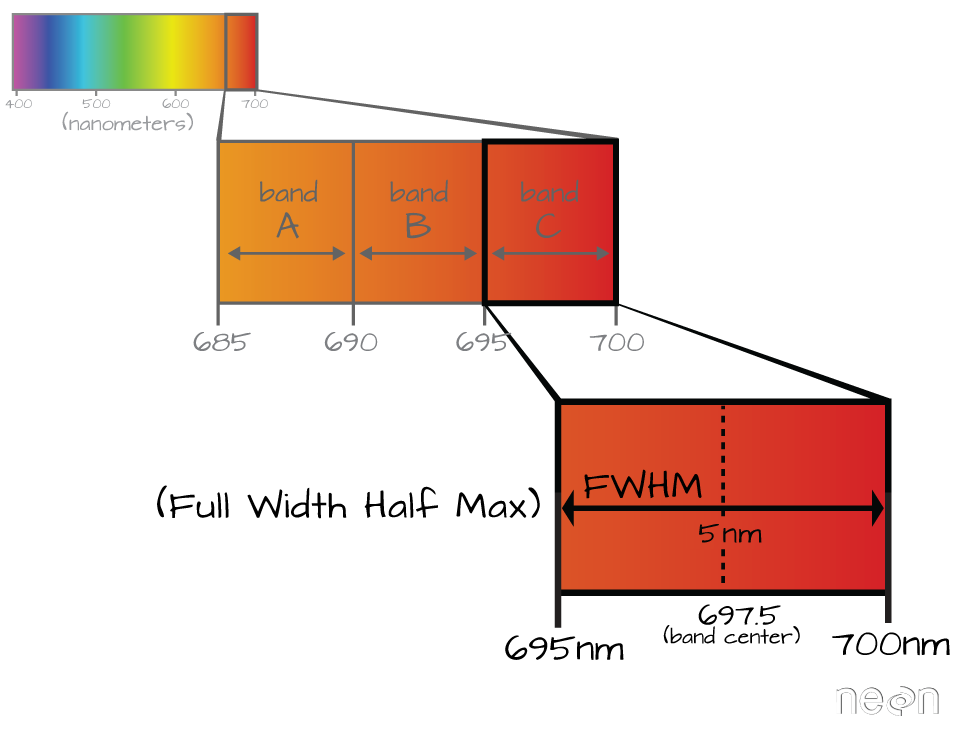
The Full Width Half Max (FWHM) of a band relates to the distance
in nanometers between the band center and the edge of the band. In this
case, the FWHM for Band C is 5 nm.
In the illustration above, the band that covers 695-700nm has a FWHM of 5 nm.
While a general spectral resolution of the sensor is often provided, not all sensors create bands of uniform widths. For instance bands 1-9 of Landsat 8 are listed below (Courtesy of USGS)