Spotlight
Before and After the Fire: What NEON Data Reveal About Wildfires and Forest Recovery
October 30, 2026
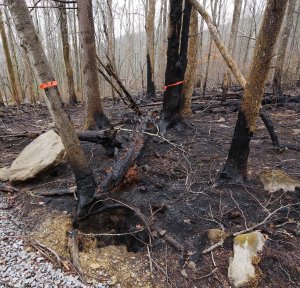
Wildfires can transform a forest in a matter of days, but the changes leading up to a fire and the recovery that follows can unfold over years or even decades. Several National Ecological Observatory Network (NEON) field sites have experienced significant wildfires, creating valuable opportunities for research. With detailed ecological data collected before and after the fires, scientists can investigate how forest conditions change over time, from vegetation stress and tree mortality to post-fire recovery.
Dr. Keith Krause brings extensive experience in remote sensing to this research. A remote sensing scientist with Battelle's Research Initiatives team, Keith began working with NEON's Airborne Observation Platform (AOP) in 2010, helping develop data products from its airborne instruments. His expertise spans satellite imaging down through airborne and unmanned aircraft systems (UAS) and field-based measurements, including lidar and hyperspectral remote sensing, with a particular focus on measuring vegetation structure.
Today, Keith is applying that expertise to a NASA-funded research project associated with NASA's Surface Topography and Vegetation (STV) initiative, which is exploring the requirements for future Earth-observing systems. Using high-resolution NEON data, Keith is investigating how accurately and frequently these systems need to measure three-dimensional changes in forests and other landscapes. Wildfires provide a valuable case study because they can dramatically alter vegetation structure before, during, and after a fire.
We spoke with Keith about what NEON data reveal before and after wildfires and how these observations could help shape the future of Earth observation.
A Conversation with Dr. Keith Krause
Can you tell us more about your work with NASA's Surface Topography and Vegetation initiative and why you're using wildfires as a case study?
NASA's Surface Topography and Vegetation initiative is exploring how to measure Earth's surface and vegetation in three dimensions. Rather than focusing on a single satellite mission, NASA is considering an observing system that could combine measurements from different platforms.
My research, funded through NASA's Decadal Survey Incubation program, focuses on developing software tools to help us determine how to produce reliable measurements of changes in vegetation structure. Part of that involves understanding what kinds of changes we can detect and how confident we can be in those measurements.
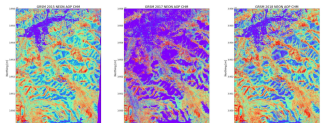
With lidar, researchers can generate maps that show the relative height of objects on the ground. These maps show the structure of the vegetation at the Great Smoky Mountains National Park NEON (GRSM) field site in 2015 before a fire, in 2017 shortly after the fire, and in 2018 after a period of recovery.
Wildfires provide a useful case study because they can dramatically alter a forest. We can look at the conditions leading up to a fire, measure the loss of trees and biomass, and then follow how vegetation grows back. By studying these changes with NEON's high-resolution data, we can help determine what future observing systems will need to measure.
What makes NEON's combination of airborne remote sensing and ground-based ecological data particularly valuable for studying wildfires?
One of NEON's biggest advantages is the combination of detailed measurements collected at the same sites over time.
The Airborne Observation Platform (AOP) gives us two complementary views of a forest. Its imaging spectrometer measures reflected light, including wavelengths beyond what our eyes can see, that can help us assess vegetation health and stress. Lidar uses laser measurements to determine the height of the ground and vegetation, so we can examine tree height and canopy structure.
The AOP data are detailed enough to detect changes at the scale of individual trees. Satellites cover much larger areas, but existing spaceborne lidar systems generally don't provide that same level of detail.
Then we have NEON's field observations. Teams identify tree species and document changes in vegetation and other organisms. That helps us interpret what we're seeing from above. NEON's weather measurements provide additional environmental context. And because we have repeated observations, we can see not just what a forest looks like today, but how it is changing over time.
What do data from the Soaproot Saddle NEON field site in California reveal about forest conditions leading up to the wildfires there?
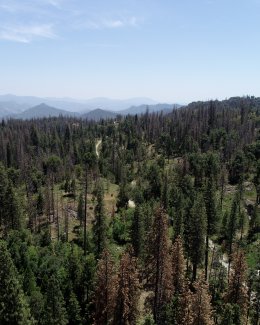
Soaproot Saddle NEON (SOAP) is an interesting example because the forest was changing dramatically before the fires.
California had experienced years of severe drought, compounded by bark beetle infestations. Many trees were dying, and we can track that progression in the AOP imagery. In 2013, much of the forest appeared green. By 2017 and 2018, more trees had turned red or brown as their needles died. That's sometimes called red attack. Later, the needles fell off, leaving dead, gray-looking trees in the gray attack stage.
The lidar data show how those changes affected the forest's structure. Dead trees fell, and many were removed for safety, especially near roads. We can see the resulting losses in canopy height.
Then the Creek Fire in 2020 and Blue Fire in 2021 affected the site. The later AOP imagery shows additional canopy loss, exposed ground, and burn scars. Because NEON collected data before and after the fires, researchers can investigate how drought, insect damage, and changing fuel conditions may have influenced fire severity. Those same observations also provide a baseline for studying how the forest recovers in the years ahead.
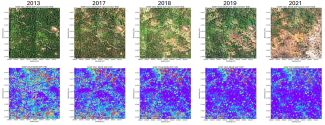
Top: SOAP field site imaging spectroscopy data showing vegetation conditions over time. Bottom: Lidar data that shows the relative height of the canopy with purple indicative of the ground elevations and red being the tallest trees. As you move from left to right, the time series data shows a loss of vegetation and canopy height over time.
That doesn't tell us exactly how the fires started or how severe they were in every location. But it gives researchers a way to investigate how changing vegetation and fuel conditions may have influenced fire severity.
What have you observed about forest recovery at the Great Smoky Mountains National Park NEON field site following the 2016 wildfire?
Great Smoky Mountains National Park NEON (GRSM) gave us a chance to look at what happens after a fire. We have AOP data from 2015, before the Chimney Tops 2 Fire, and from 2017 and 2022.
In the 2017 imagery, you can clearly see burned areas and substantial losses in canopy height. By 2022, though, much of the landscape looks green again in the color images. At first glance, you might think the forest has recovered.
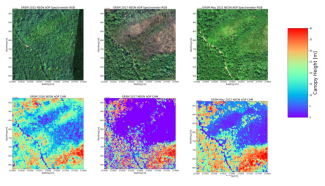
AOP spectrometer data showing GRSM field site vegetation in 2015, 2017, and 2022. A fire burned at GRSM in 2016. The green vegetation appears to recover by 2022, but the lidar-derived height data (bottom) reveals more dark blue and purple areas indicating shorter vegetation like grasses and shrubs. The tall tree canopy loss from the fire has not come back in the burn scar area.
But the lidar data tell a different story. Many of those green areas still have very low vegetation, probably grasses, shrubs, or young trees. The tall canopy that was there before the fire hasn't returned in many places. That's why three-dimensional measurements are so useful. We can see not only that vegetation is growing back, but how its structure compares with what was there before.
There are also questions about what is growing back. Are the same tree species returning, or are different species taking advantage of the openings created by the fire? NEON's field observations can help us explore that. At GRSM, for example, field teams observed some plants that are normally uncommon becoming abundant in heavily burned plots.
Recovery may involve changes in the whole vegetation community, not simply the return of green cover.
What are some of the challenges in determining what future Earth-observing systems will need to measure?
A major question is how much detail different applications require. With AOP, we can detect changes involving individual trees. But a system measuring vegetation globally from space may not be able to provide that level of resolution everywhere.
For estimating biomass loss across a large area, coarser measurements might be sufficient. If we're studying wildlife habitats or the distribution of vegetation at finer scales, individual trees and the vertical structure of the canopy may matter much more. A satellite measurement covering many trees might not detect the loss of one tree, for example, even though it could reveal changes across an entire stand.
Timing is another challenge. At SOAP, for example, we have a four-year gap between the 2013 and 2017 collections. A lot happened during those years, but we can't pinpoint when each change occurred.
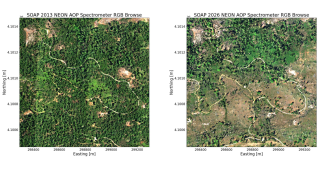
SOAP spectrometer data in 2013 and then in 2026 showing how the landscape has changed.
So we're asking what we gain or lose by measuring every year instead of every five or 10 years, and what scale of change we really need to detect. We haven't reached definitive answers yet. NEON provides the detailed reference measurements that help us evaluate those tradeoffs.
How could better measurements of forest change help scientists and land managers understand wildfire risk and recovery?
It's difficult to know exactly where a fire will start. But if we can monitor tree health, mortality, and changes in vegetation structure ahead of time, we can better understand the conditions that could make a fire more severe.
That information could help land managers assess risks and prioritize where to focus their attention. If we know where vegetation is stressed or dying and where fuel conditions may contribute to more severe fires, that gives us a better understanding of the risks in those areas. After a fire, structural measurements can show how much vegetation and biomass were lost and how recovery is progressing.
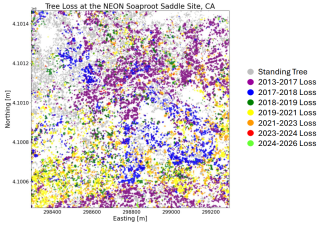
Tree loss over time at the SOAP field site. Severe drought and pine bark beetles affected trees leading up to 2017 and dead trees were felled near roads and infrastructure (purple and blue area of loss). Two fires burned in 2020 and 2021 (yellow and orange area of loss).
We can also connect those changes to broader ecological questions. As forests change, habitats change too. Understanding the structure of the vegetation, along with which species are present, can help researchers explore how the ecosystem responds over time. We can also investigate how different environmental conditions and land management activities may influence those changes.
Learn how to calculate vegetation biomass from lidar data in Python
What has been most interesting or surprising to you as you've explored these changes in forests?
I think it's how much is going on in forests that we might not realize unless we're there every day or really digging into the data.
In the West, we're seeing the effects of drought and bark beetles. In eastern forests, insects such as emerald ash borer (Agrilus planipennis) and hemlock woolly adelgid (Adelges tsugae) are affecting other tree species. Trees die, and different species begin to take over those areas.
Those dynamics are fascinating to me. And they're not limited to wildfire-impacted forests. With NEON's repeated observations across different ecosystems, we can see changes that might otherwise go unnoticed and begin to understand how forests are evolving over time.