NSF NEON, Operated by Battelle

Main navigation

  • About
    • NEON Overview
      • Vision and Management
      • Spatial and Temporal Design
      • History
    • About the NEON Biorepository
      • ASU NEON Biorepository Staff
      • Contact the NEON Biorepository
    • Observatory Blog
    • Newsletters
    • Staff
    • FAQ
    • User Accounts
    • Contact Us

    About

  • Data
    • Data Portal
      • Data Availability Charts
      • API & GraphQL
      • Prototype Data
      • Externally Hosted Data
    • Data Collection Methods
      • Airborne Observation Platform (AOP)
      • Instrument System (IS)
        • Instrumented Collection Types
        • Aquatic Instrument System (AIS)
        • Terrestrial Instrument System (TIS)
      • Observational System (OS)
        • Observation Types
        • Observational Sampling Design
        • Sampling Schedules
        • Taxonomic Lists Used by Field Staff
        • Optimizing the Observational Sampling Designs
      • Protocols & Standardized Methods
    • Getting Started with NEON Data
      • neonUtilities for R and Python
      • Learning Hub
      • Code Hub
    • Using Data
      • Data Formats and Conventions
      • Released, Provisional, and Revised Data
      • Data Product Bundles
      • Usage Policies
      • Acknowledging and Citing NEON
      • Publishing Research Outputs
    • Data Notifications
    • NEON Data Management
      • Data Availability
      • Data Processing
      • Data Quality

    Data

  • Samples & Specimens
    • NEON Biorepository Sample Portal at ASU
    • About Samples
      • Sample Types
      • Sample Repositories
      • Megapit and Distributed Initial Characterization Soil Archives
    • Finding and Accessing Sample Data
      • Species Checklists
      • Sample Explorer - Relationships and Data
      • Biorepository API
    • Requesting and Using Samples
      • Requesting Samples from the NEON Biorepository
      • Request Megapit and Initial Characterization Soil
      • Sample Use Guidelines
      • Sample Use Policy
      • Acknowledging and Citing the NEON Biorepository

    Samples & Specimens

  • Field Sites
    • Field Site Map and Info
    • Spatial Data Layers & Maps

    Field Sites

  • Resources
    • Getting Started with NEON Data
    • Research Support Services
      • Field Site Coordination
      • Letters of Support
      • Permits and Permissions
      • AOP Flight Campaigns
      • Research Support FAQs
      • Research Support Projects
    • Code Hub
      • neonUtilities for R and Python
      • Code Resources Guidelines
      • Code Resources Submission
      • NEON's GitHub Organization Homepage
    • Learning Hub
      • Tutorials
      • Workshops & Courses
      • Science Videos
      • Teaching Modules
    • Science Seminars and Data Skills Webinars
    • Document Library
    • Funding Opportunities

    Resources

  • Impact
    • Research Highlights
    • Papers & Publications
    • NEON in the News

    Impact

  • Get Involved
    • Upcoming Events
    • Past Events
    • Research and Collaborations
      • Environmental Data Science Innovation and Inclusion Lab
      • Collaboration with DOE BER User Facilities and Programs
      • EFI-NEON Ecological Forecasting Challenge
      • NEON Great Lakes User Group
      • NCAR-NEON-Community Collaborations
      • Sage Grande Testbed
    • Advisory Groups
      • Science, Technology & Education Advisory Committee (STEAC)
      • Innovation Advisory Committee (IAC)
      • Technical Working Groups (TWG)
    • NEON Ambassador Program
      • Exploring NEON-Derived Data Products Workshop Series
    • Partnerships
    • Community Engagement
    • Work Opportunities

    Get Involved

  • My Account
  • Search

Search

About

  • NEON Overview
  • About the NEON Biorepository
  • Observatory Blog
  • Newsletters
  • Staff
  • FAQ
  • User Accounts
  • Contact Us

Breadcrumb

  1. About
  2. Observatory Blog
  3. Can AI Unlock the Hidden Data in Biological Collections?

Research Highlight

Can AI Unlock the Hidden Data in Biological Collections?

August 31, 2026
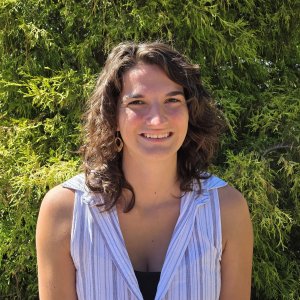
Alyson East Headshot

What’s the question? How can AI-enabled image analysis turn physical specimens into large-scale trait data for ecological research?

The big picture: Biological collections hold vast amounts of information about how organisms vary across space, time and environments, but much of that information has been difficult to use at scale because extracting traits from physical specimens is slow and labor-intensive. AI-enabled image analysis can help unlock that information, turning carefully curated specimens into large, reusable trait datasets that make new kinds of biodiversity and ecological research possible.

NEON Biorepository samples used:

Researchers used carabid (ground beetle) samples from the NEON Biorepository, including:

  • Pinned carabid specimens
  • Ethanol-preserved carabid specimens from 2018 pitfall-trap collections

The pinned specimens included beetles from all of NEON’s 47 terrestrial sites, whereas the ethanol-preserved specimens represented 30 NEON sites, all together covering 518 species.

Researcher(s): Alyson East (under the supervision of PhD advisor Sydne Record at the University of Maine), Nathan Cain, S.M. Rayeed, Samuel Stevens, Tanya Berger-Wolf, Charles Stewart. Special thanks to Leah Cotton, Jacqueline Dominguez, and Michael Belitz for their support in preparing and photographing specimens at the NEON Biorepository and to Isadora Fluck and Benjamin Baiser for their support in photographing ethanol-preserved specimens. Special thanks also to the NSF funded Imageomics Institute for hosting Alyson East and Sydne Record to enable this interdisciplinary collaboration.

What they did and what they learned:

East and her collaborators developed a workflow to turn physical ground beetle specimens into analysis-ready trait data. They first established standardized methods for photographing specimens so the resulting images would work for computer vision, including consistent positioning, lighting, scale references, and metadata. The team then photographed NEON ground beetle specimens and used computer vision to detect individual beetles within group images, crop them into separate images and link each specimen back to its NEON data record.
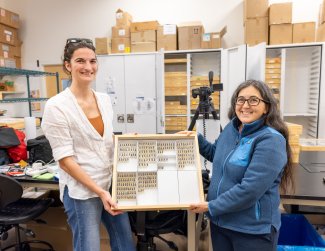
Alyson East and Sydne Record holding a beetle collection tray

Alyson East and Sydne Record hold up beetle collection trays at the NEON Biorepository. Photo courtesy of Isa Betancourt.

From there, the researchers used image-analysis models to measure elytra (wing cover) length, a reliable proxy for overall body size. Because every measurement remains associated with information about the specimen’s species name and collection location, including NEON site and plot, the team can compare body-size patterns across species and environmental gradients. The initial dataset paper includes more than 13,200 digitized specimens and validates image-based measurements against physical caliper measurements. The team has since expanded the number of images and automated trait measurements; the dataset now includes roughly 80,000 beetle measurements, to be published early next year.

“We’ve never been able to measure invertebrate traits at this scale before. These methods and this interdisciplinary collaboration open up new and novel data streams that allow us to answer foundational questions where we’ve been hampered by limited data.” – Alyson East, The University of Maine  

Those measurements are beginning to reveal patterns that would have been difficult to examine at this spatial extent and across so many individuals before. Beetle communities span a wide range of body sizes, with substantial overlap among some species. Within individual species, average body size can also shift among NEON sites and even among plots within the same site, raising questions about the relative influence of environmental conditions and competition on local trait distributions.

One of the clearest patterns so far is geographic: average beetle body size tends to be larger at lower latitudes and smaller farther north. This “inverse Bergmann’s” pattern runs opposite to the classic trend seen in many warm-blooded animals. East is still analyzing what drives these patterns, including the roles of growing-season constraints, environmental filtering, and competition. The larger goal is not simply to measure beetles faster, but to create the volume of standardized trait data needed to test long-standing ecological theories at a continental-scale.

Read more:  

  • From collection trays to AI-ready data: An operational framework for automated batch entomological specimen processing (preprint: ARPHA, in review Biodiversity Data Journal)
  • A continental-scale dataset of ground beetles with high-resolution images and validated morphological trait measurements (preprint: arXiv, accepted in Nature Scientific Data)
  • BeetleFlow: An integrative deep learning pipeline for beetle image processing (preprint: arXiv)

This work was recognized with the Best NEON Presentation Award at the 2026 Ecological Society of America (ESA) Annual Meeting for the presentation, “A Use Case of AI-Enabled Macroecology: Unlocking Ecological Insights from Natural History Collections for Continental-Scale Trait-Based Research”
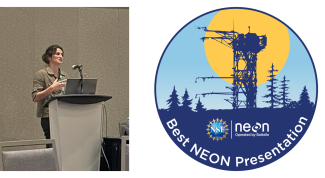

Alyson East giving a presentation and the Best NEON Presentation award emblem
Alyson East presenting her talk "A Use Case of AI-Enabled Macroecology: Unlocking Ecological Insights from Natural History Collections for Continental-Scale Trait-Based Research” at ESA 2026. 

Share

Related Posts:

What Can Gut Microbes Tell Us About Animal Evolution?

July 31, 2026

Headshot of Dr. Taichi Suzuki

NEON Ambassador Spotlight: Reid Longley

August 3, 2026

Headshot of Dr. Reid Longley

What's New at the NEON Biorepository? A Conversation With Dr. Hojun Song

February 25, 2026

photo of person
NSF NEON, Operated by Battelle

Follow Us:

Join Our Newsletter

Get updates on events, opportunities, and how NEON is being used today.

Subscribe Now

Footer

  • About Us
  • Contact Us
  • Terms & Conditions
  • Careers
  • Code of Conduct

Copyright © Battelle, 2026

The National Ecological Observatory Network is a major facility fully funded by the U.S. National Science Foundation.

Any opinions, findings and conclusions or recommendations expressed in this material do not necessarily reflect the views of the U.S. National Science Foundation.